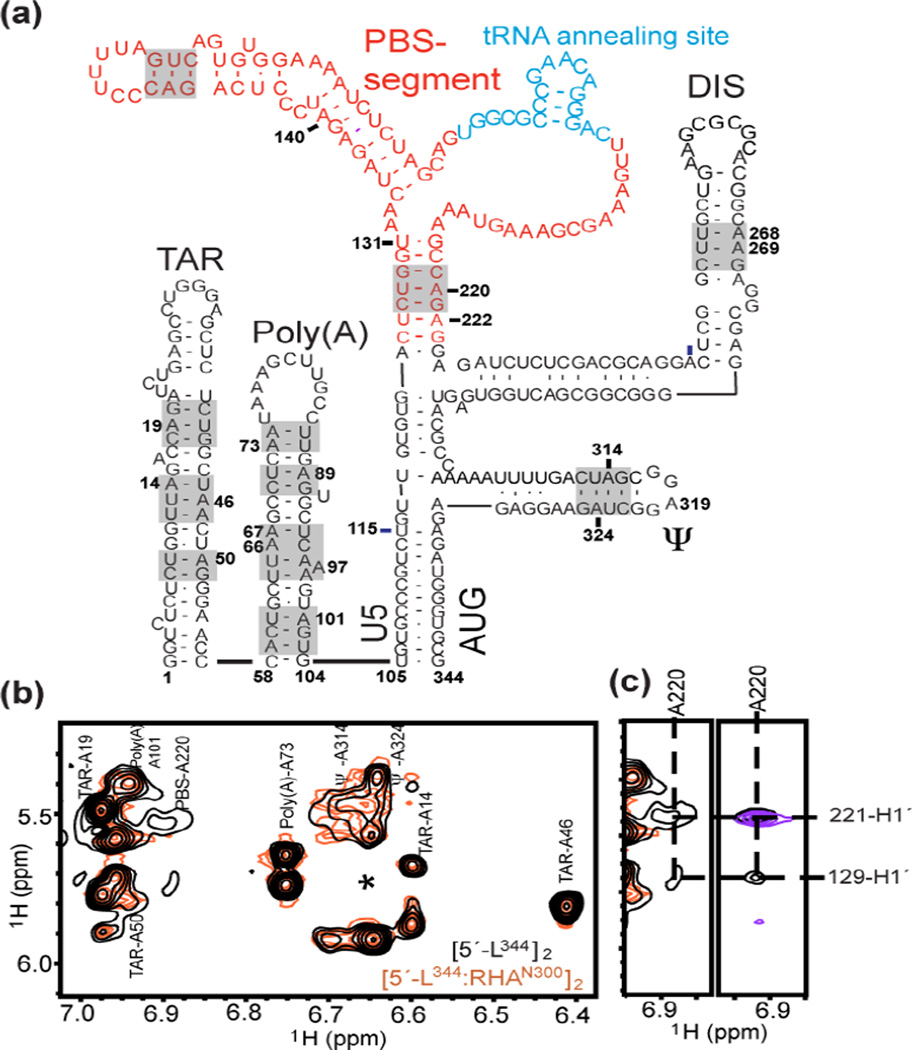
Fig. 3.
RHAN300 binds to the PBS-segment of the dimeric 5′-UTR. (a) Sequence and secondary structure of 5′-L344 are shown. The PBS-segment is highlighted in red, and the 18-nt sequence complementary to tRNALys3 is highlighted in cyan. The base pairs in the gray-boxed region were verified by assignment of outlier peaks. (b) Assignments of the adenosine H2 signals are shown. Broad PBS-A220 signals were observed in [5′-L344]2 (black), and their line widths were beyond detection in the [5′-L344:RHAN300]2 complex (orange). The asterisk denotes the A268 H2 signals that only show at very low levels. (c) Left panel, zoom-in view of the PBS-A220 H2 signals. Right panel, the cross peak of A220-H2 and G129-H1′ in the PBS segment RNA (black) spectrum disappeared or shifted upon RHAN300 titration (purple), indicating that RHAN300 bound to the PBS-segment within the dimeric 5′-L344.

