
Fig. 1.
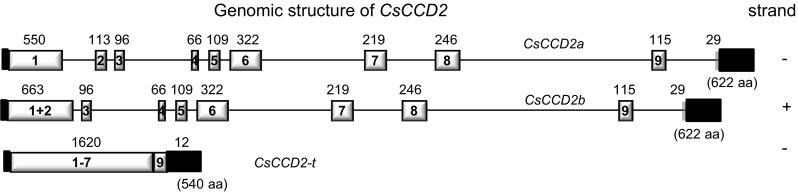
Analysis of the exon–intron structures of CsCCD2 genes. Schematic diagram of the exon–intron structures of CsCCD2 genes. Gray and black boxes indicate exons and untranslated regions (UTRs), respectively. Introns are indicated by lines. The size of each exon is indicated over the exon boxes in base pairs and the size of the protein products in presented on the left of each gene in parenthesis