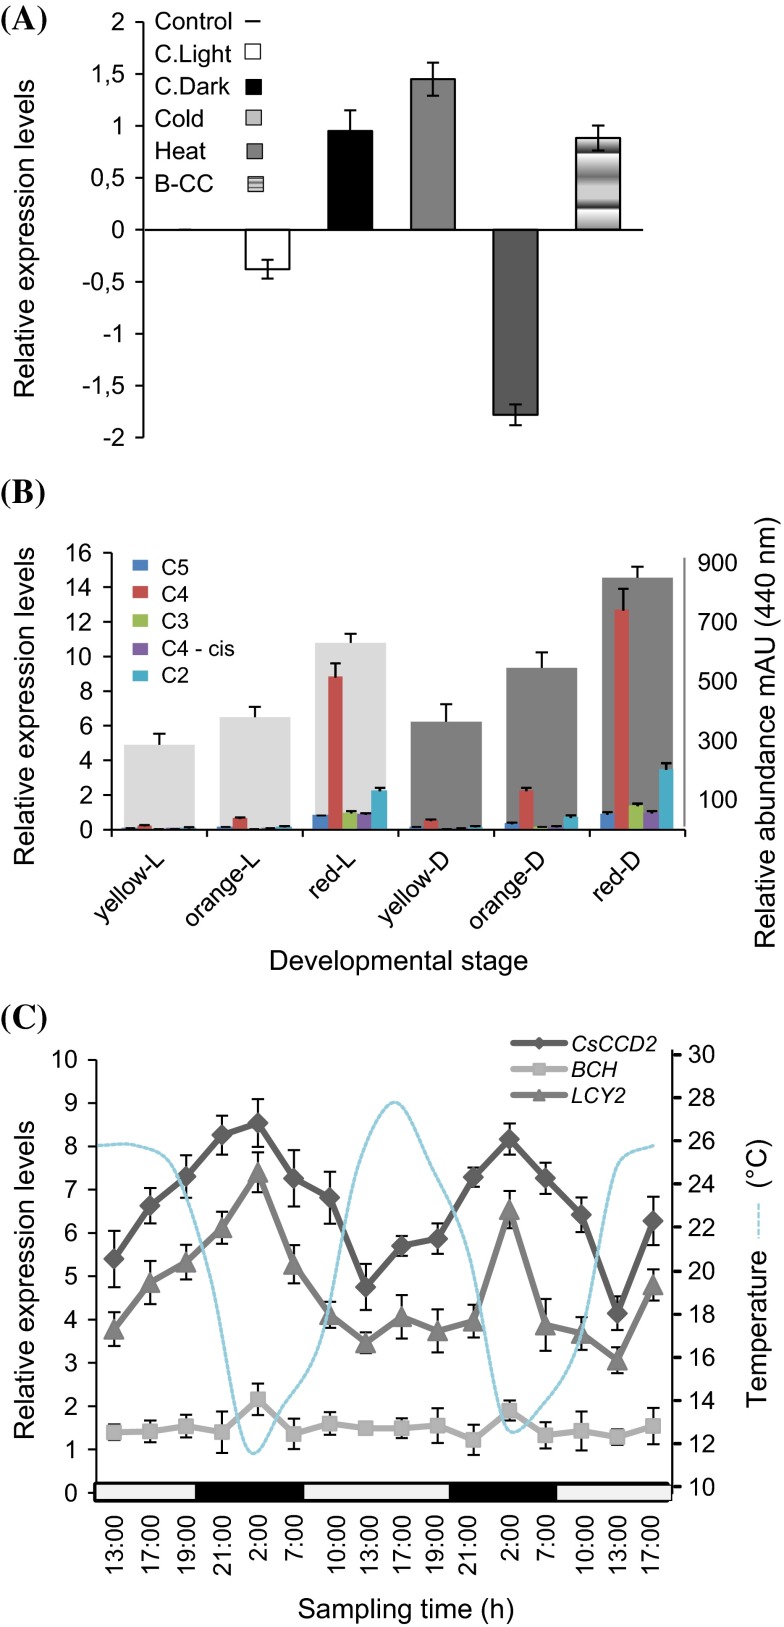
Fig. 5.
Validation of CsCCD2 expression based on the elements identified by in silico promoter analysis by qRT-PCR. a Expression levels of CsCCD2 under different light and temperature conditions. Represented values were obtained after subtracting the control value. c Light stands for continuous light and C. Dark stands for continuous dark. b Expression levels of CsCCD2 in stigmas at different developmental stages (yellow, orange, and red) from plants growing in continuous dark (yellow-D, orange-D and red-D) or normal (light/dark) conditions (yellow-L, orange-L and red-L) are plotted on the left y-axe. Crocins levels (on the right axe) for each treatment and developmental stage are also indicated. C5, trans-crocin with 5 glucose molecules; C4, trans-crocin with 4 glucose molecules; C4-cis, cis-crocin with 4 glucose molecules; C3, trans-crocin with 3 glucose molecules; C2, trans-crocin with 2 glucose molecules crocins abundance on. c Expression data of CsCCD2, CsBCH2 and CsLycB2a from plants growing in field. Expression levels are plotted on the left y-axe, and temperature on the right. White box on x-axe, light interval; black box, dark interval

