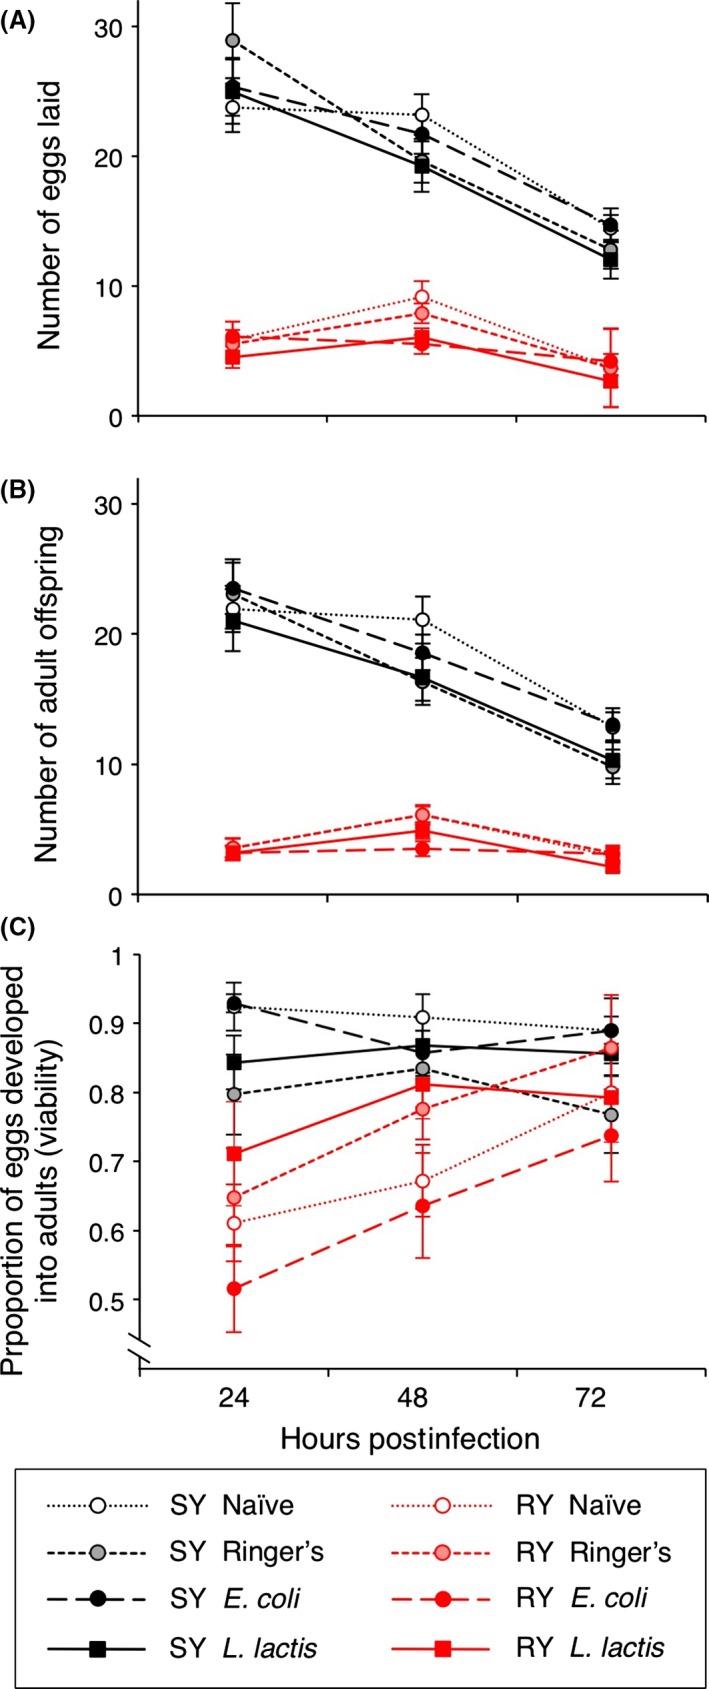
Figure 2.

Female fecundity differed in response to diet and bacterial infection over a continuous 72‐h period post‐infection. Fecundity was measured as (A) eggs laid per 24‐h period, (B) adult offspring, and (C) the proportion of eggs that completed development to adults (viability). SY indicates the standard yeast diet and RY the reduced yeast diet. Each mean is calculated from the eggs and offspring of between 27 and 30 flies. Error bars show 1 SE. For statistics, see Table 1.
