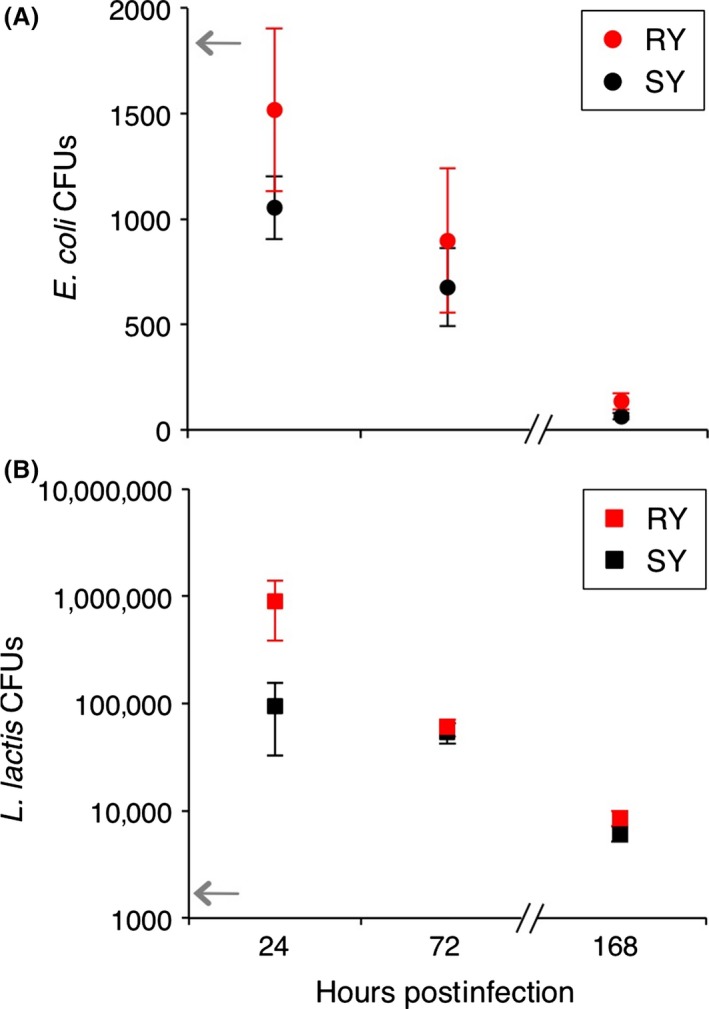
Figure 3.

Bacterial load was affected by time post‐infection and not diet. Bacterial loads of (A) E. coli and (B) L. lactis were quantified as colony‐forming units (CFU), for 24 and 72 h (experiment 1) and 168 h (experiment 2) post‐infection. RY indicates reduced yeast diet and SY the standard diet. Each mean is calculated from the CFU counts of between 21 and 30 female flies. Error bars show 1 SE. For statistics, see Table 2. The gray arrows indicate the approximate initial injection doses.
