
Figure 4.
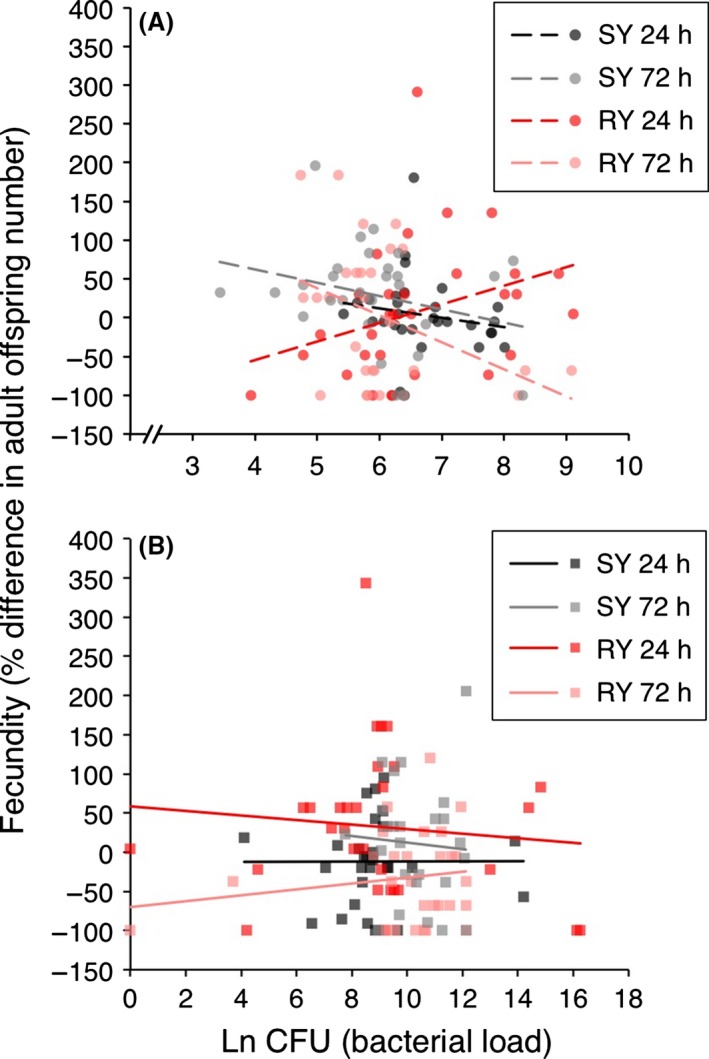
Tolerance after E. coli infection varies by diet and day post‐infection. Tolerance curves are plotted for (A) E. coli and (B) L. lactis on SY and RY at 24 and 72 h post‐infection. The natural log of bacterial load (CFUs) is plotted on the x‐axis, and the fecundity measure, percent difference in adult offspring number, is given on the y‐axis. The fecundity measure was calculated within diet treatment groups as follows: ((infected fecundity, ω i) ‐ (uninfected fecundity ω 0))/ω 0) × 100. Each data point gives the bacterial load and fitness of one individual female. For statistics, see Table 3.