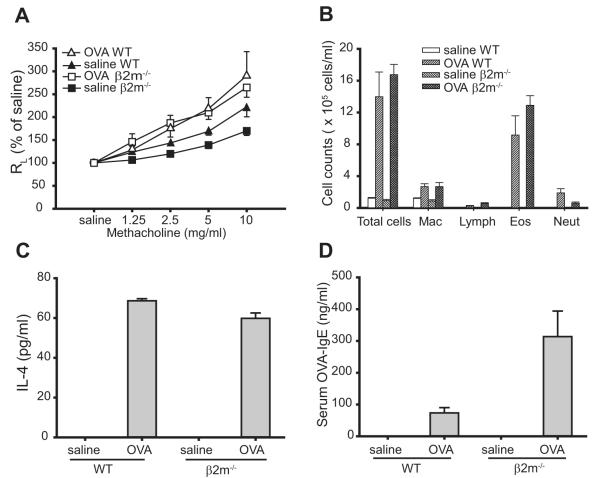
FIGURE 1.
Development of allergen-induced AHR, airway inflammation, and Th2 responses in β2m−/− mice. A, β2m−/− mice develop allergen-induced AHR. AHR was determined by invasive measurement of airway resistance (RL) in response to increasing doses of methacholine in sensitized mice 24 h after the last OVA challenge. Data represent the mean ± SEM percentage of saline value from three experiments (n = 9–16). Values of p are 0.019 for OVA WT vs saline WT and <0.0001 for OVA β2m−/− vs saline β2m−/−. B, β2M−/− mice induce airway eosinophilia. BAL fluid from mice in A was analyzed immediately after AHR measurement. Data represent the number of cells per milliliter in BAL fluid and are the mean ± SEM, representative of three experiments. Mac, Macrophage; Lymph, lymphocytes; Eos, eosinophils; Neut, neutrophils. C, β2m−/− mice induce OVA-induced IL-4 production from bronchial lymph node T cells. Bronchial lymph nodes from mice in A were removed and analyzed immediately after AHR measurement. IL-4 was measured by ELISA in supernatants from the lymph node cell cultures stimulated with 25 μg/ml OVA. Data are the mean ± SEM, representative of three experiments. D, β2m−/− mice produce OVA-specific serum IgE. OVA-specific IgE was measured by ELISA in sera taken from mice in A, immediately after AHR measurement. Data are the mean ± SEM, representative of three experiments.

