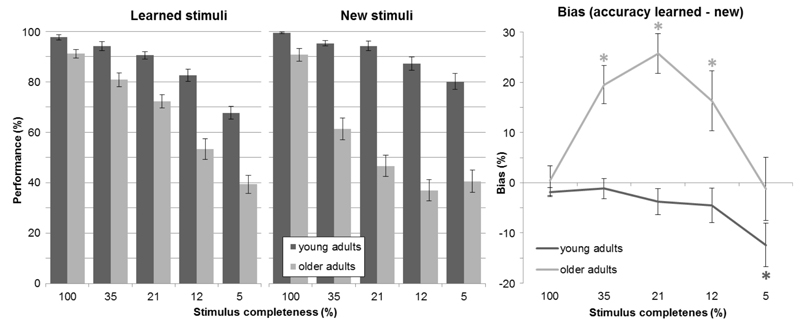
Fig. 2. Performance and bias measures.
Left, performance for both age groups, separately for learned and new stimuli for the 5 different levels of stimulus completeness (mean ± SE); right, bias measure (see section 2.4. for a detailed explanation) - difference in accuracy scores for learned minus new stimuli calculated separately for each participant (mean ± SE); positive values indicate a bias toward pattern completion, significant differences from 0 are indicated with * separately for each age group as indicated by color.

