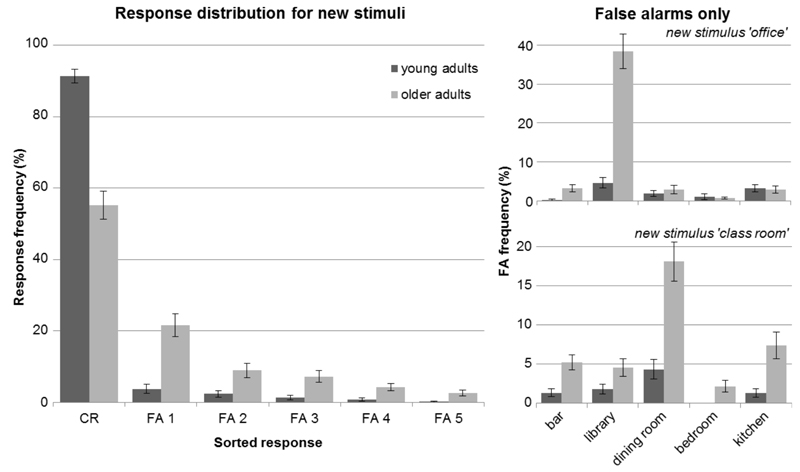
Fig. 3. Response distribution for new stimuli.
Left, responses are depicted over the 6 possible choice options (i.e. 'none of these' as correct rejections - CR, and the false alarms sorted according to frequency – FA 1-5; mean ± SE) showing that older adults chose one particular false response option most often (FA 1) rather than guess more overall, which would lead to similar frequencies for all 5 response options. Right, distributions of false alarms are depicted for 2 exemplary stimuli per actual false response option (i.e. label of the learned stimuli; mean ± SE).

