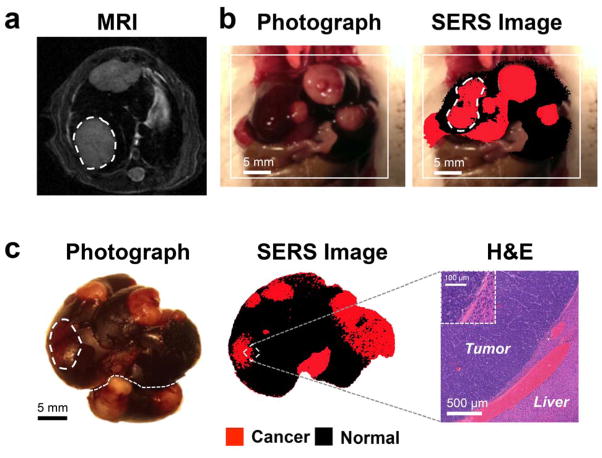
Figure 3. SERS NPs enable delineation of liver tumors (Genetic Myc-driven HCC mouse model).
(a) T2-weighted axial MR images through the liver show hyperintense lesions corresponding to the tumors (one of them is outlined with a dashed line). (b) Photograph and in vivo SERS image (overlaid) shows the liver with several tumors in red (outlined tumor corresponds in location to the tumor outlined on MRI). (c) Photograph and corresponding SERS image of the excised liver, showing multiple liver tumors (red). Histology with H&E staining confirms the precise delineation of the liver tumor margin by SERS imaging. Inset: Magnified view of the tumor-liver margin. SERS images were produced using DCLS, as described in Methods.

