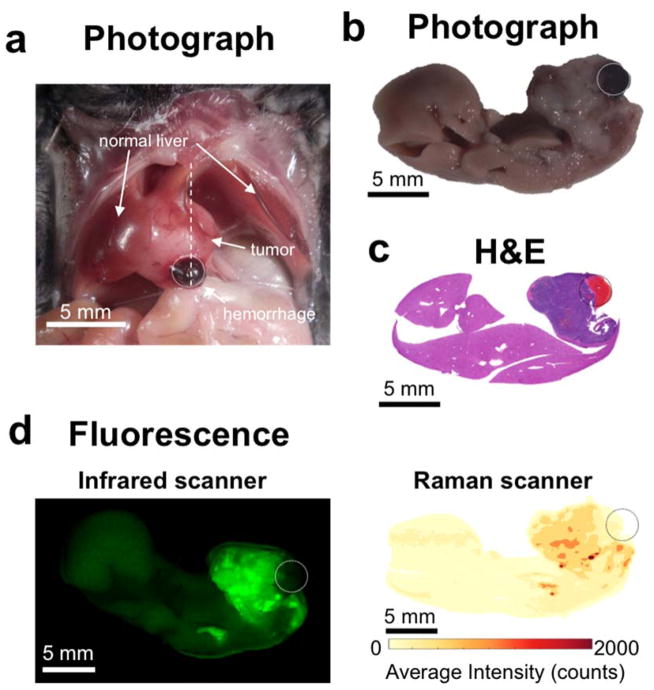
Figure 7. ICG misses area of tumor-associated hemorrhage.
(a) Photograph of the exposed mouse abdomen, showing a large tumor with an associated hematoma (circled). (b) Photograph, and (c) H&E staining of the excised liver, sliced along the dotted line in (a). (d) Left: scan with the infrared fluorescence scanner demonstrates that ICG can visualize the tumor, but not the hemorrhage. Right: in the absence of SERS NPs, the Raman spectrometer faithfully captures the fluorescence of ICG. The average intensity across all wavenumbers is plotted.

