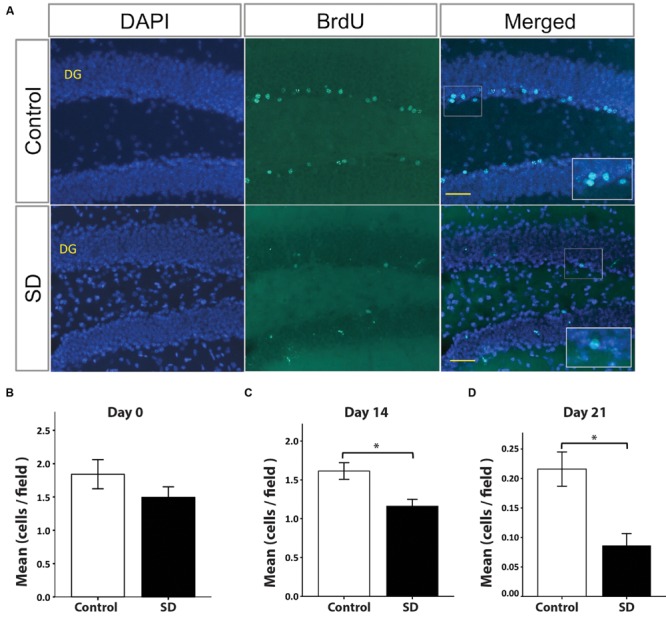
FIGURE 4.

BrdU+ cells in the dentate gyrus decrease in REM SD groups. Representative pictures by immunofluorescence of the dentate gyrus (DG) of controls and the SD group (A). The number of BrdU+ cells in DG (green) was significantly reduced by the effect of SD at different time points: day 0 (B), day 14 (C), and day 21 (D). Bars indicate the mean of BrdU+ cells per field (445 μm2) ± SE. Asterisks Indicate statistical differences (Mann–Whitney “U” test). Nuclei are in blue by DAPI staining. Scale bar = 10 μm.
