FIGURE 5.

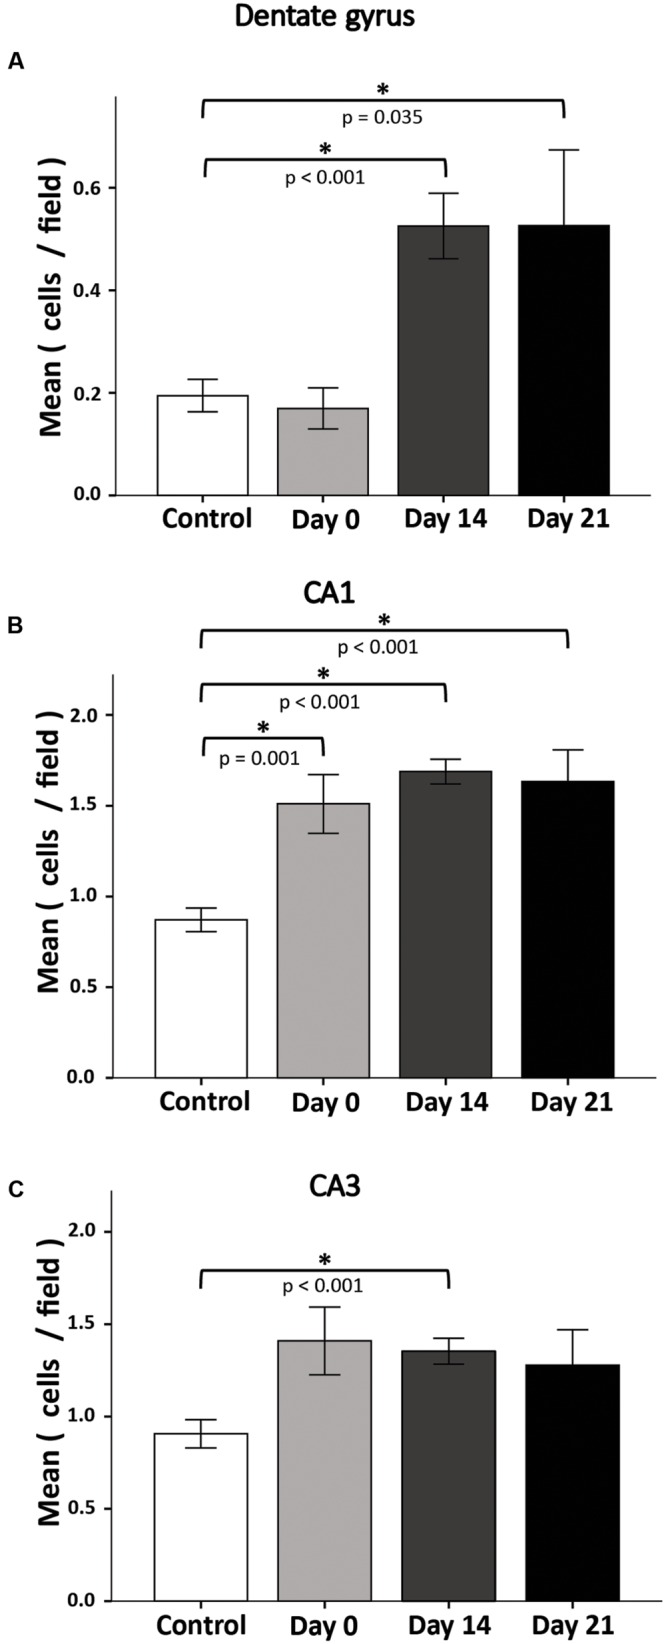
Apoptosis rate in the DG(A), CA1(B), and CA3(C) after 72-h REM SD. Plots represent the mean ± SE of TUNEL+ cells by field (445 μm2). Asterisks indicate significant differences (Mann–Whitney “U” test).

Apoptosis rate in the DG(A), CA1(B), and CA3(C) after 72-h REM SD. Plots represent the mean ± SE of TUNEL+ cells by field (445 μm2). Asterisks indicate significant differences (Mann–Whitney “U” test).