FIGURE 6.

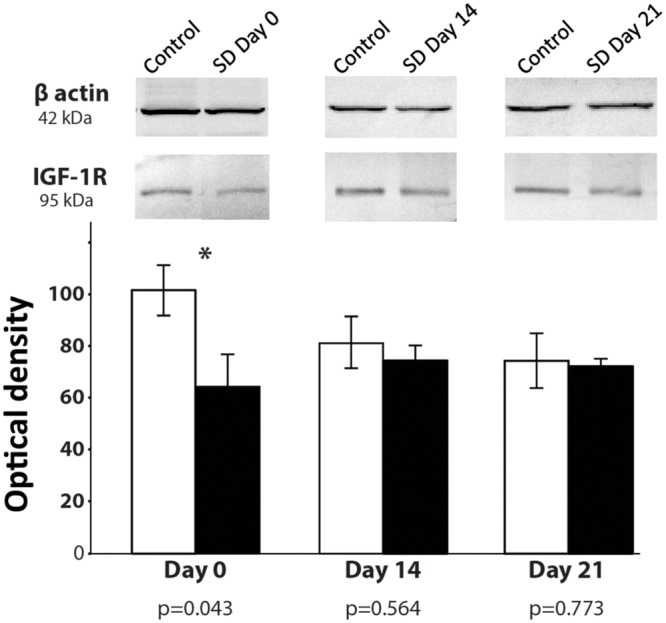
p-IGF-1R expression after 74-h REM SD. Graphics show the mean ± SE of the optical density for p-IGF-1R expression. Asterisks show significant difference. SD = 72-h REM sleep deprivation.

p-IGF-1R expression after 74-h REM SD. Graphics show the mean ± SE of the optical density for p-IGF-1R expression. Asterisks show significant difference. SD = 72-h REM sleep deprivation.