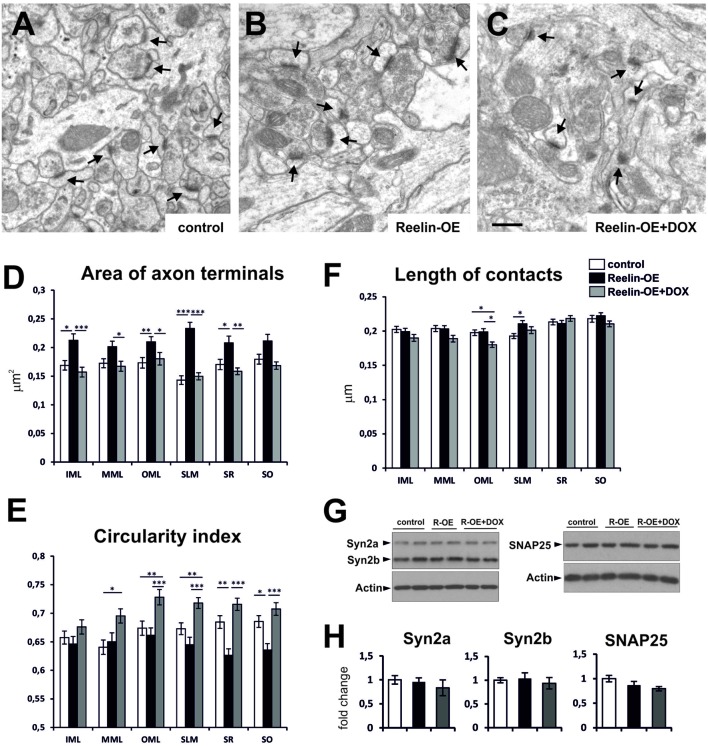
FIGURE 1.
Fine structure and molecular phenotype of axon terminals in Reelin-OE mice. (A–C) Electron micrographs illustrating axon terminals establishing synaptic contacts (arrows) in the inner molecular layer of control, Reelin-OE, and DOX-treated Reelin-OE mice. (D–F) Histograms showing area (D), circularity index (E), and length of synaptic contact (F) of axon terminals in different hippocampal layers in control, Reelin-OE, and DOX-treated Reelin-OE mice (mean ± SEM; *p < 0.05, **p < 0.01, ***p < 0.001; ANOVA test). (G) Western-blot analysis of a and b isoforms of Synapsin 2, and SNAP25 in synaptosomal fractions of the hippocampus. (H) Quantification of Synapsin 2a, Synapsin 2b, and SNAP-25 values from triplicate experiments. Values are normalized to the levels of actin and expressed as percentage of control mice (mean ± SEM, ANOVA test). IML, inner molecular layer; MML, medial molecular layer, OML, outer molecular layer; SLM, stratum lacunosum-moleculare; SO, stratum oriens; SR, stratum radiatum. Scale bar in (A–C), 0.5 μm.

