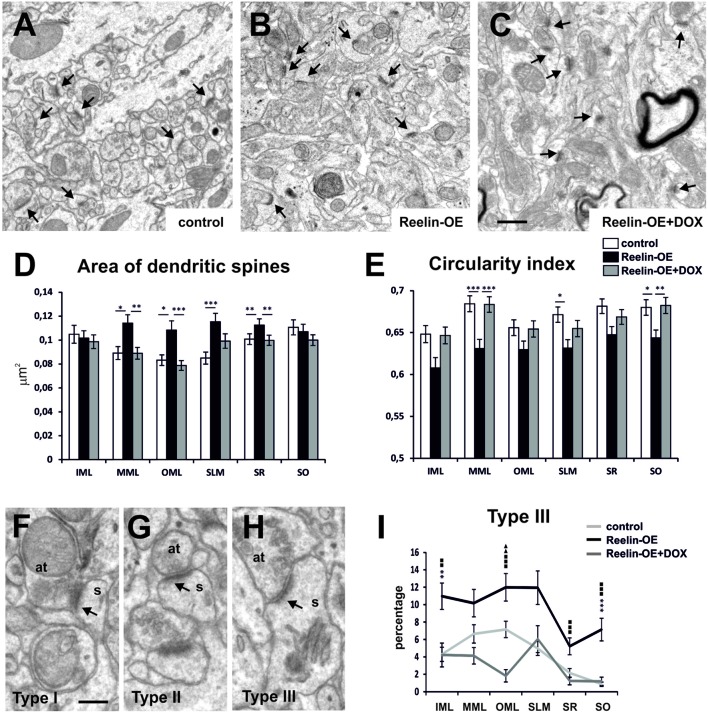
FIGURE 2.
Fine structure of dendritic spines in Reelin-OE mice. (A–C) Electron micrographs illustrating dendritic spines receiving synaptic inputs (arrows) in the inner molecular layer of control, Reelin-OE, and DOX-treated Reelin-OE mice. (D,E) Histograms showing area (D) and circularity index (E) of dendritic spines in different hippocampal layers in control, Reelin-OE, and DOX-treated Reelin-OE mice (mean ± SEM; *p < 0.05, **p < 0.01, ***p < 0.001; ANOVA test). (F–H) Electron micrographs showing three types of defined dendritic spines depending on PSD curvature (see text): type I (F), type II (G), and type III (H). (I) Histogram illustrating the percentage of type III dendritic spines in all the hippocampal layers in control, Reelin-OE, and DOX-treated Reelin-OE mice (mean ± SEM; *p < 0.05, **p < 0.01, ***p < 0.001 for control vs. Reelin-OE mice; squares for Reelin-OE vs. Reelin-OE+DOX; triangles for control vs. Reelin-OE+DOX mice; ANOVA test). IML, inner molecular layer; MML, medial molecular layer, OML, outer molecular layer; SLM, stratum lacunosum-moleculare; SO, stratum oriens; SP, stratum pyramidale. Scale bars, (A–C) = 0.5 μm; (F–H) = 200 nm.

