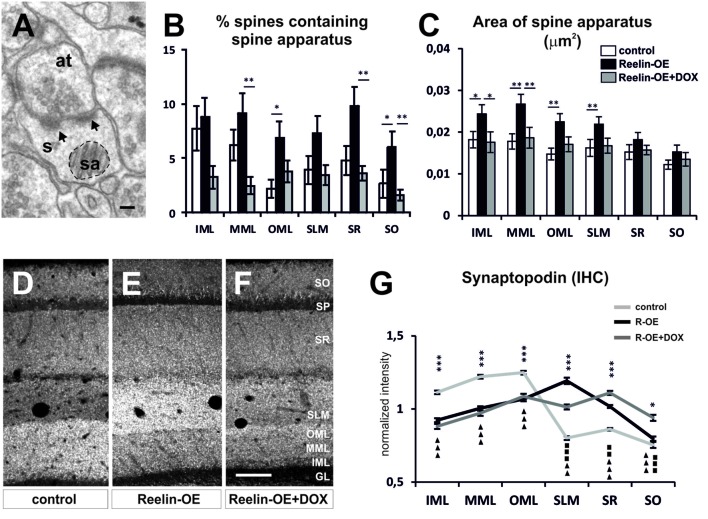
FIGURE 3.
Spine apparatus and Synaptopodin in dendritic spines of Reelin-OE mice. (A) Electron micrograph of dendritic spines (s) containing a spine apparatus (sa) and receiving two synaptic contacts (arrows) from an axon terminal (at). Dashed-line circle represents an example of the area of spine apparatus used to perform analysis in (C). (B,C) Histograms illustrating the percentage of dendritic spines containing spine apparatus (B) and the area of these organelles (C) in distinct hippocampal layers of control, Reelin-OE, and DOX-treated Reelin-OE mice (mean ± SEM; *p < 0.05, **p < 0.01; ANOVA test). (D–F) Immunolabeling for Synaptopodin in hippocampal sections of control, Reelin-OE, and DOX-treated Reelin-OE mice. (G) Quantitative determination of immunofluorescence signals in control, Reelin-OE, and Reelin-OE+DOX mice. Diagram shows continuous linear profiles of fluorescence intensities in vertical stripes of hippocampal sections from the stratum oriens to the granule layer for Synaptopodin. The intensity of fluorescence is represented in gray levels (mean ± SEM; *p < 0.05, **p < 0.01, ***p < 0.001 for control vs. Reelin-OE mice; squares for Reelin-OE vs. Reelin-OE+DOX; triangles for control vs. Reelin-OE+DOX mice; ANOVA test). GL, granular layer; IHC, immunohistochemistry; IML, inner molecular layer; MML, medial molecular layer; OML, outer molecular layer; SLM, stratum lacunosum-moleculare; SO, stratum oriens; SP, stratum pyramidale; WB, western blot. Scale bars, (A) = 100 nm; (F,G) = 100 μm.

