FIGURE 5.
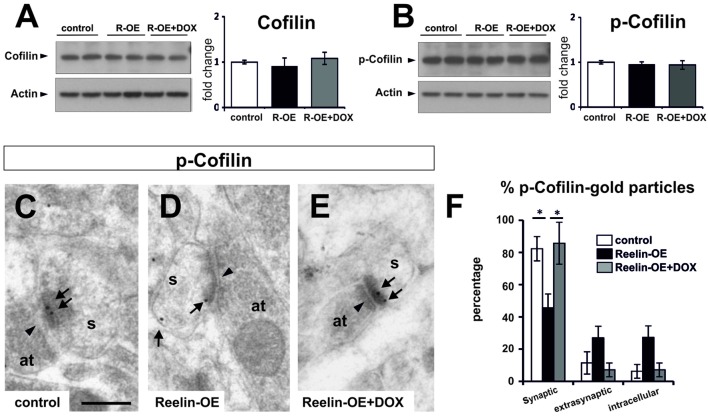
Expression of Cofilin and p-Cofilin in Reelin-OE mice. (A) Left, immunoblot analysis of Cofilin in control, Reelin-OE, and DOX-treated Reelin-OE mice. Right, histogram showing densitometric analysis (n = 3 animals per group) by fold change in the three groups of mice (mean ± SEM; ANOVA test). (B) Left, immunoblot analysis of p-Cofilin in control, Reelin-OE, and DOX-treated Reelin-OE mice. Right, histogram showing densitometric analysis (n = 3 animals per group) by fold change in the three groups of mice (mean ± SEM; ANOVA test). (C–E) Examples of immunogold labeling against p-Cofilin in dendritic spines (s) receiving a synaptic contact from an axon terminal (at) in the SR of control (C), Reelin-OE (D), and DOX-treated Reelin-OE (E) mice. Note synaptic contacts indicated by arrowheads and immunolabeling dots by arrows. Scale bar, 250nm. (F) Histogram illustrating the proportion of dots in the synaptic contact, the extrasynaptic membrane and the intracellular domain of dendritic spines in the SR of Reelin-OE and DOX-treated Reelin-OE mice and their control littermates (mean ± SEM; *p < 0.05; ANOVA test).

