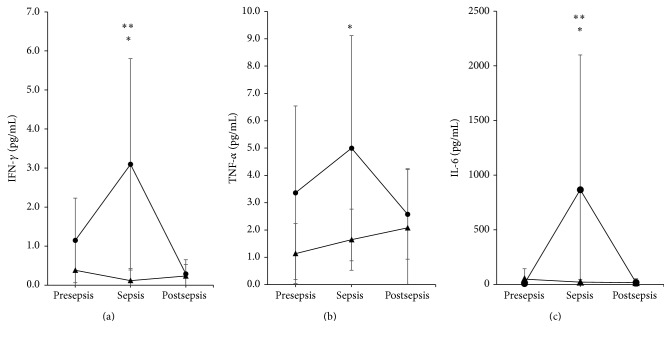
Figure 3.
Proinflammatory cytokines. IFN-γ (a), TNF-α (b), and IL-6 (c) showed similar patterns during the sepsis process (mean ± standard deviation). During sepsis, the values for the PT infants (circle) were elevated compared with VPT (triangle) infants (∗ P < 0.01, Student's t-test). Values at sepsis were higher than pre- and postsepsis in the case of IFN-γ and IL-6 for PT group (∗∗ P < 0.01, Friedman test).

