
Figure 13.
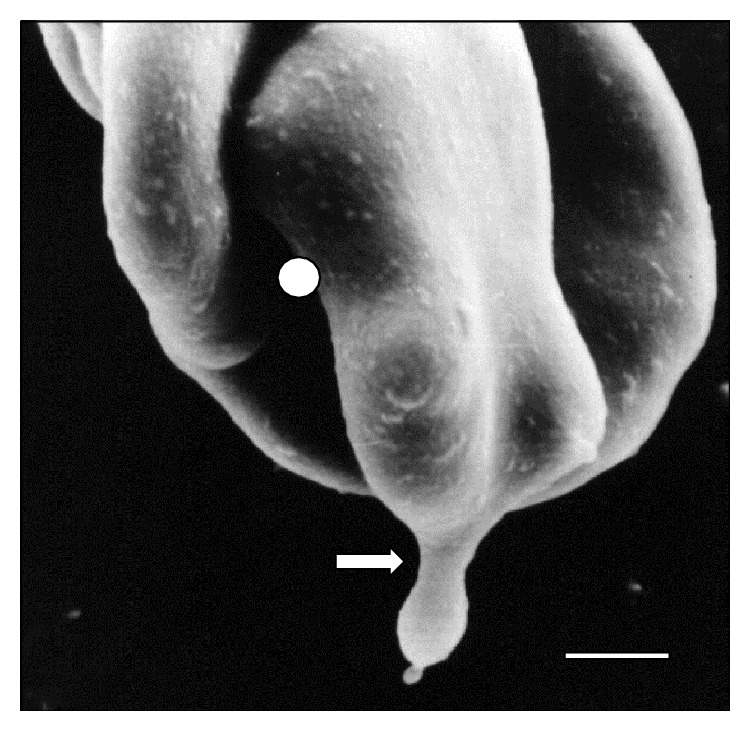
High resolution micrograph of a sheep RBC cluster showing a deformed RBC (◯) with small vesicles and emission of a pseudopod (⇒) at 15 days of infection. Bar = 1.3 μm.
Official websites use .gov
A
.gov website belongs to an official
government organization in the United States.
Secure .gov websites use HTTPS
A lock (
) or https:// means you've safely
connected to the .gov website. Share sensitive
information only on official, secure websites.
High resolution micrograph of a sheep RBC cluster showing a deformed RBC (◯) with small vesicles and emission of a pseudopod (⇒) at 15 days of infection. Bar = 1.3 μm.