
Figure 1.
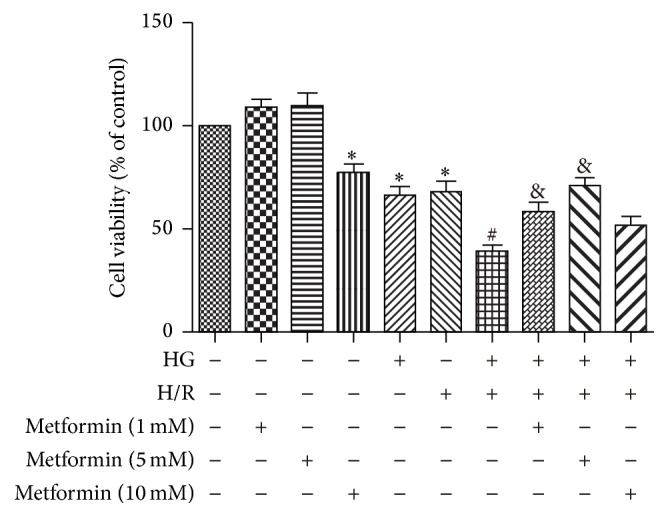
Dose-dependent effects of metformin on HG + H/R induced reduction in cell viability. H9C2 cells were treated with different concentrations of metformin (0, 1, 5, and 10 mM). A “+” symbol indicates presence and a “−” symbol indicates absence of the relevant treatment condition, such as HG (33 mM), H/R, and various concentrations of metformin. Cell viability of each group was estimated using the CCK-8 assay. Data are shown as means ± SD of 3 independent experiments. ∗ P < 0.05 versus Control; # P < 0.05 versus HG or H/R; & P < 0.05 versus metformin + HG + H/R.