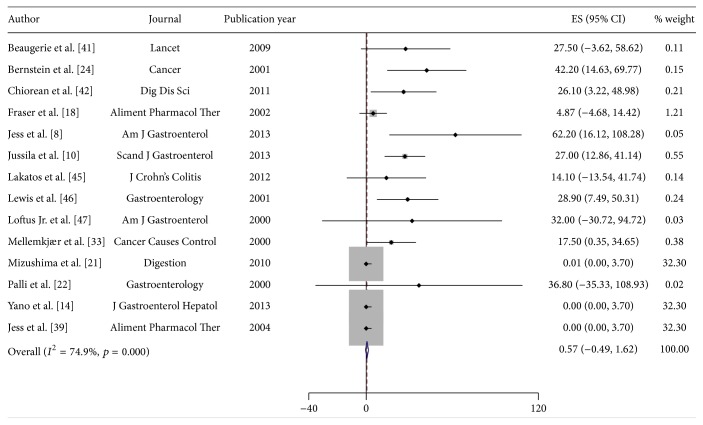
Figure 4.
Incidence of lymphoma in patients with Crohn's Disease (CD). Each incidence estimate is presented followed by the 95% confidence intervals (CIs). Each square in the plot indicates the point estimate of the incidence. The diamond represents the summary incidence from the pooled studies. Error bars depict the 95% CIs.

