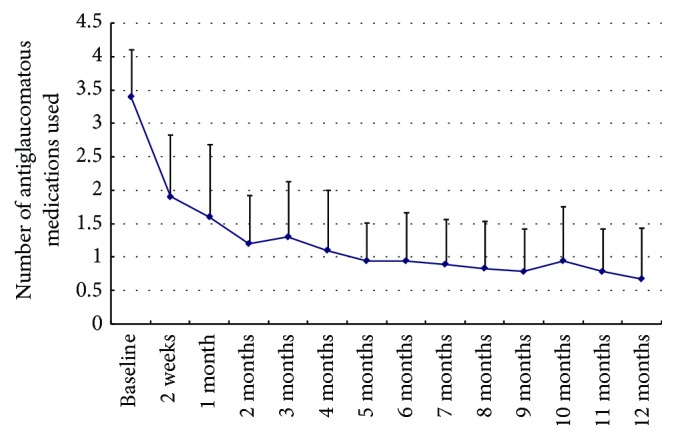
Figure 2.

Graph showing changes in the number of antiglaucomatous medications applied from baseline to 12 months after treatment. At every follow-up visit, compared to baseline, the number of antiglaucomatous medications undertaken significantly reduced (P < 0.01).
