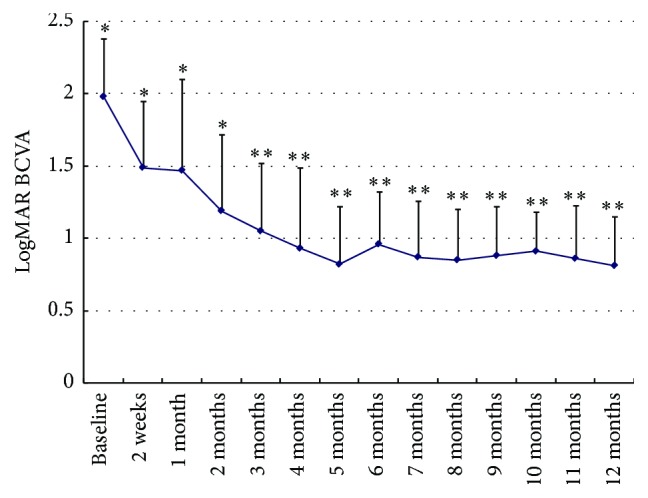
Figure 3.

Graph showing changes in mean logarithm of the minimum angle of resolution (logMAR) best-corrected visual acuity (BCVA) from baseline to 12 months after treatment. At earlier visits follow-up (week 2 till month 2), BCVA revealed a modest improvement compared to baseline (P < 0.05). At the remaining visits (month 3 till month 12), the improvement of BCVA reached the significant level compared to baseline (P < 0.01). ∗ represents P < 0.05; ∗∗ represents P < 0.01.
