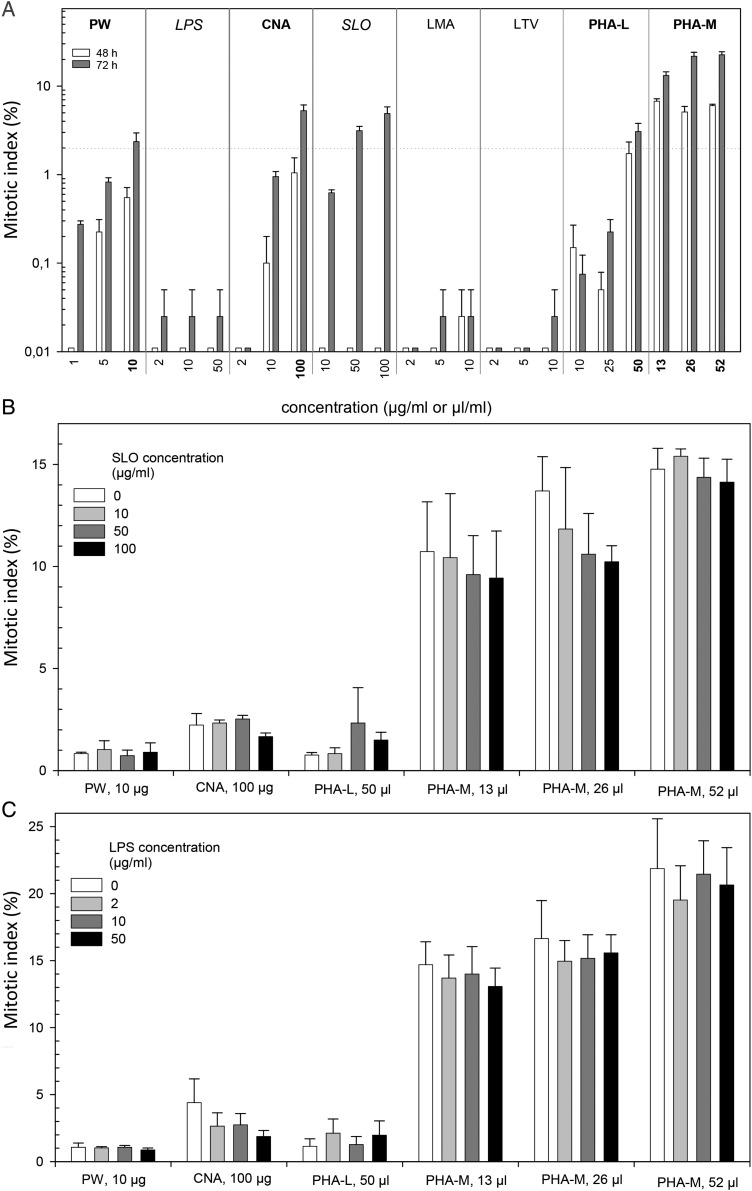
Figure 1.
The MI was measured in lymphocytes stimulated by each of the seven mitogens and PHA-M alone using different concentrations (A) or a combination of selected mitogens with either LPS (B) or SLO (C). For PHA-L and PHA-M working solutions in microliters of rehydrated PHA/ml culture medium are given instead of weight/volume values. (A) Mitogenic activity was examined after incubation with mitogens for 48 h (white bars) and 72 h (dark gay bars) in separate experiments. Bars represent the mean of up to three independent experiments, and counts are provided from two technicians each of them counting two slides, which sums up to four to eight measurements per experimental condition. Error bars reveal the standard error of mean (n = 4–8). The 0 % MI are changed to values of 0.02 % in order to visualise them on a log scale. Drugs inducing >2 % mitosis either after 48 or 72 h of incubation time are highlighted in bold letters. The MI includes second mitosis, whose frequency was marginally for all drugs except for PHA-M with up to one-third of the MI represented by second mitosis. (B, C) In further experiments, lectin concentrations inducing >2 % MI were combined with LPS as well as SLO due to hints in the literature regarding increased mitogenic activity for lectin combinations with either LPS or SLO. The MI were determined after 72 h of incubation for four lectins comprising different concentrations (in total six conditions), which were combined with either LPS or SLO applied in three concentrations (control: without LPS/SLO). Bars represent the mean of two to three independent experiments, and counts are provided from one to two slides, which sums up to three to four measurements per experimental condition. Error bars reveal the standard error of mean (n = 3–4).

