
Figure 1.
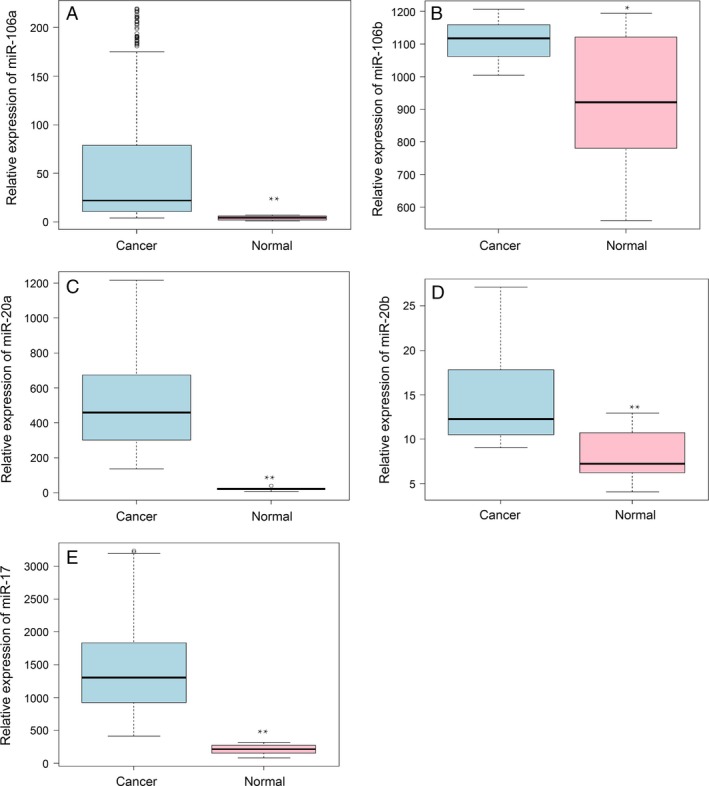
miR‐106a/b, miR‐20a/b, and miR‐17 were upregulated in the colorectal cancer compared with normal tissues. The expression level of the miR‐106a (A), miR‐106b (B), miR‐20a (C), miR‐20b (D), miR‐17 (E) between colorectal cancer (light blue) and normal (pink) samples in The Cancer Genome Atlas database. The data has been filtered. The y‐axis is the FPKM value of the miRNA. *P < 0.05, **P < 0.01.