
Figure 2.
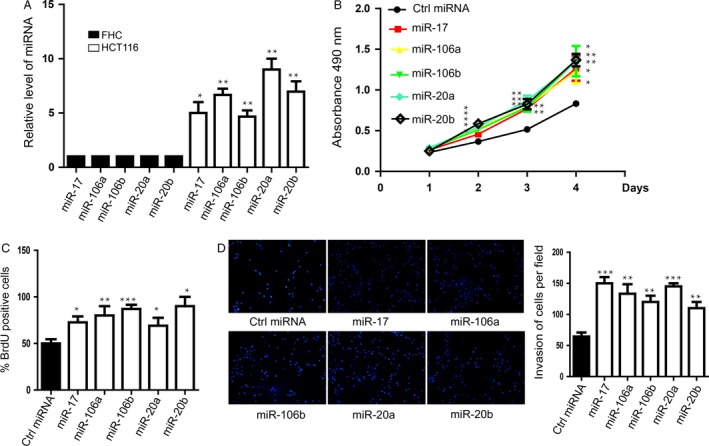
miR‐106a/b, miR‐20a/b, and miR‐17 promoted the proliferation and invasion of HCT116 cells. (A) The expressions of these five miRNAs in HCT116 cells were significantly upregulated compared with the control. Data shown are means ± SD (n = 5). *P < 0.05, **P < 0.01. (B) MTT assay was performed to determine cell proliferation with the treatment of these miRNAs mimics. Data shown are means ± SD (n = 5). *P < 0.05, **P < 0.01. (C) Bromodeoxyuridine assay was carried out to further confirm miRNAs‐promoted proliferation. Data shown are means ± SD (n = 3). *P < 0.05, **P < 0.01, ***P < 0.001. (D) Transwell assay was performed to measure the invasive capacity of HCT116 cells with the treatment of these miRNAs mimics. Right penal showed the statistics of the invasion. Data shown are means ± SD (n = 4). **P < 0.01, ***P < 0.001.