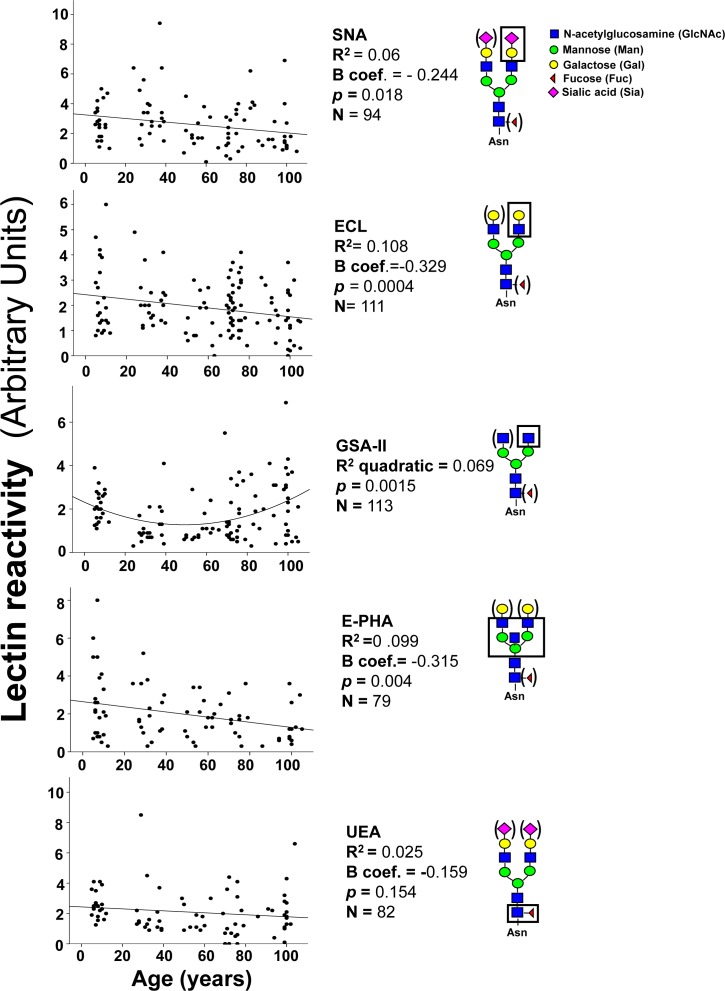
Figure 4. Lectin blot analysis of IgG glycosylation.
Diluted plasma samples were analyzed after blotting with five lectins. In each gel, the reactivity associated with IgG heavy chains of plasma samples was normalized with that of fixed amounts of commercially available IgG, used as an internal standard. Correlation analysis indicated significant inverse linear relationship with age for SNA, ECL and E-PHA and a positive quadratic relationship for GSA-II. The structures recognized by each lectin is boxed. Structures in parenthesis can be present or absent without affecting recognition by the lectin.

