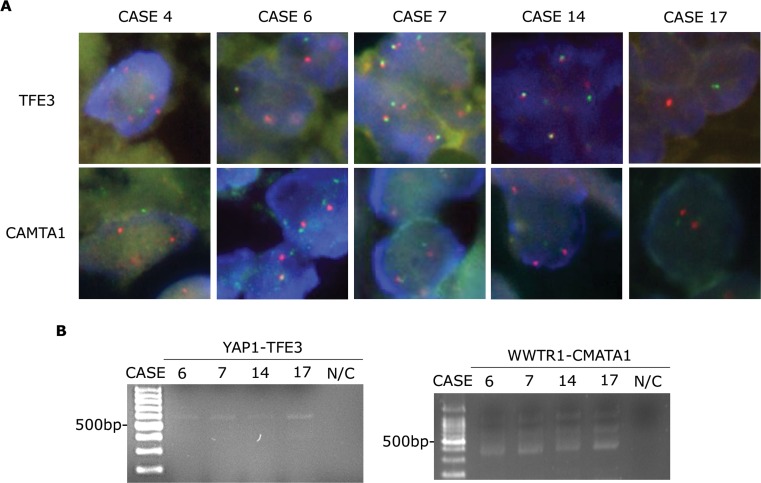
Figure 2. CAMTA1 translocation in EHEs with TFE3 rearrangements.
A. FISH assay results for TFE3 and CAMTA1 break-apart showing separated green and orange signals (1,000× magnification). B. RT-PCR assay results identifying YAP1-TFE3 (556 bp, left panel) and WWTR1-CAMTA1 fusion transcripts (400 bp, right panel). N/C, negative control.

