
Figure 4. PHLPP controls cell motility at the single cell level.
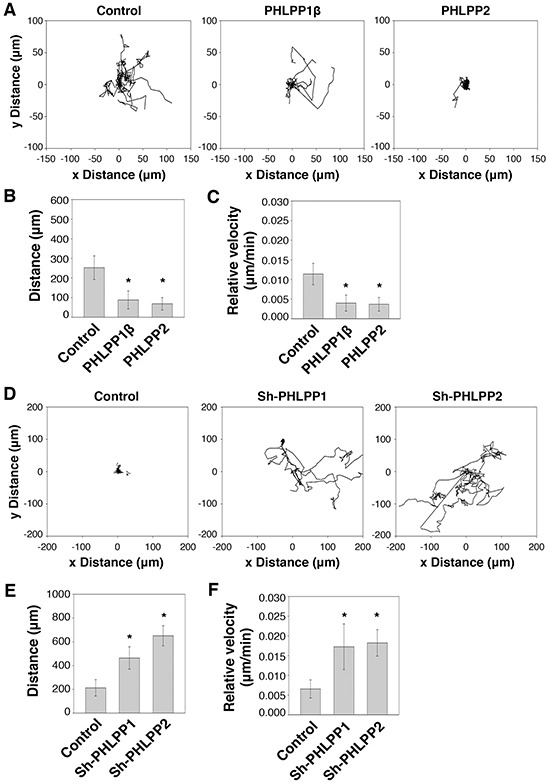
A. Migration patterns of stable control and PHLPP overexpressing Panc-1 cells on laminin coated plates using HGF as the chemoattractant. The trajectories of 12 randomly chosen cells for each cell line were plotted in the graphs. B–C. The average distance traveled (B) and the relative velocity (C) of 12 stable control and PHLPP overexpressing Panc-1 cells during 6 hours of migration. Data represent mean ± SD (n = 12 cells/line, * p<0.05 by two-sample t-tests). D. Migration patterns of stable control and PHLPP knockdown ASPC-1 cells on laminin coated plates using HGF as the chemoattractant. The trajectories of 12 randomly chosen cells for each cell line were plotted in the graphs. E–F. The average distance traveled (E) and the relative velocity (F) of 12 stable control and PHLPP knockdown ASPC-1 cells during 6 hours of migration are shown. Data represent mean ± SEM (n = 12 cells/line, * p<0.05 by two-sample t-tests).