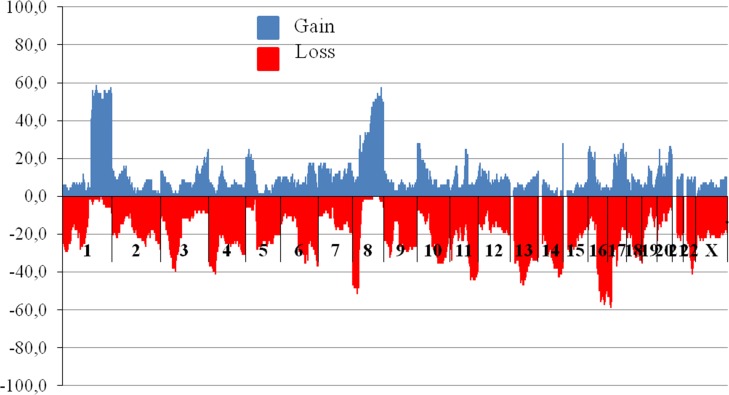
Figure 1. The frequency of CNVs in breast tumor DNA before treatment.
Abscissa – cytobands (n = 852), axis of ordinates – frequency of patients bearing CNV in tumor (%). Blue (upper horizontal dotted) and red (under horizontal dotted) are regions of gains (amplifications) and losses (deletions), respectively. For CNV study microarray analysis was performed using high density microarray platform Affymetrix (USA) CytoScan™ HD Array.

