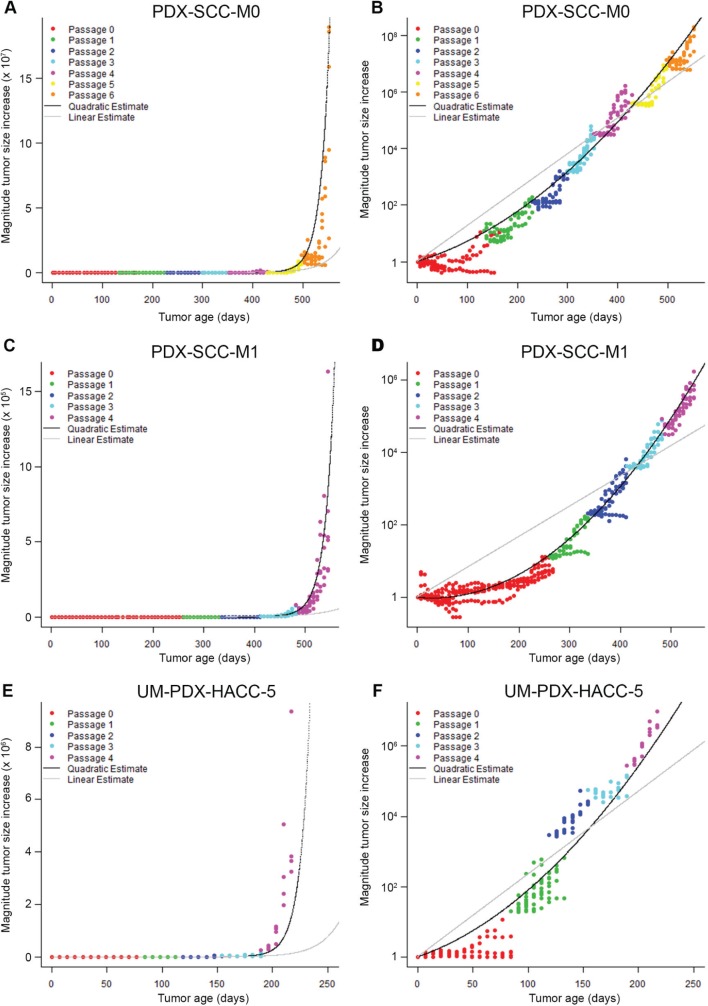
Figure 3. PDX models display increasing exponential tumor growth rates.
Relative tumor volume versus time is displayed in A. and B. for PDX-SCC-M0, N = 48 tumors total; C. and D. for PDX-SCC-M1, N = 30 tumors total; and D. and A. for UM-PDX-HACC-5, N = 55 tumors total. Prediction lines for linear mixed models including linear time model (grey) and quadratic time model (black) are superimposed. The data is expressed with untransformed axis (left column) and log 10-axis (right column). A straight line in the right-hand graphs represents a stable exponential growth rate.

