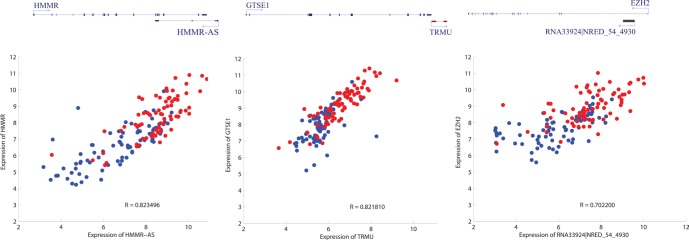
Figure 5. Three examples depicting potential cis regulation of common DE-lncRNAs on mRNAs.
Upper panel is simplified schematic diagram representing the relative genomic location of lncRNAs and their neighboring PCGs (left: antisense; middle: intergenic; right: intronic); lower panel is scatter plot characterizing the expression profile correlation of the pair of genomic interacting lncRNA and mRNA (red and blue representing cancer tissues and adjacent non-cancerous tissues respectively).

