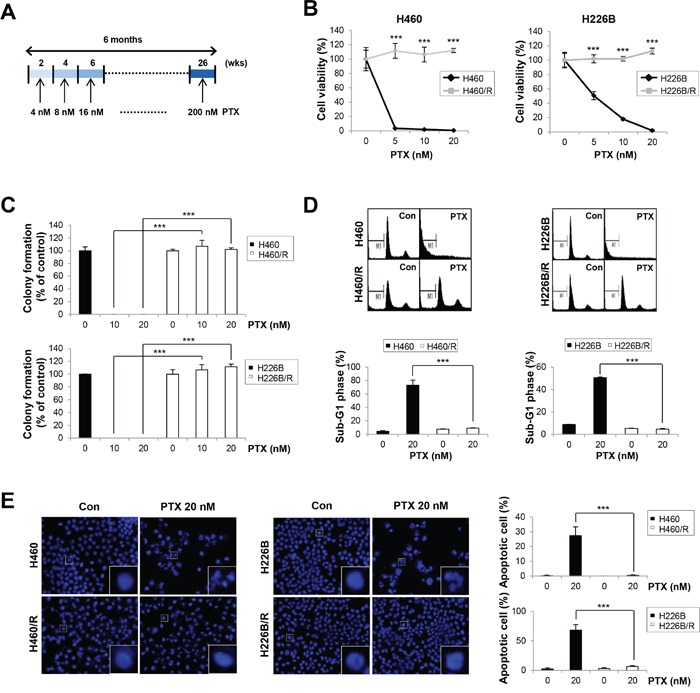
Figure 1. Establishment of PTX resistant cell lines.

A. Schedules for the creation of PTX resistant cell lines. Cells were treated with PTX at concentrations from 4 nM to 200 nM in a dose-escalating manner for 6 months. B. H460, H460/R, H226B, and H226B/R cells were treated with PTX in a dose-dependent manner for 72 h. Cell viability was evaluated using the trypan blue exclusion assay. C. Cells were grown for 10 days in medium containing 20 nM PTX. Anchorage-dependent colony formation was assessed by counting the individual colonies using Motic images plus 2.0 software. D. Cells were treated with 20 nM PTX for 72 h and incubated with PI solution for DNA content-based assessments of cell cycle distribution. The cell population in the sub-G1 phase was delineated as apoptotic cells. E. Fluorescence microscopy of DAPI-stained cells treated for 48 h with PTX (20 nM). Apoptotic cells were identified by highly condensed and fragmented nuclear DNA. The data are presented as the mean ± SD. The statistical significance was analyzed using Student's t-test (*** P < 0.001 vs. the respective control).
