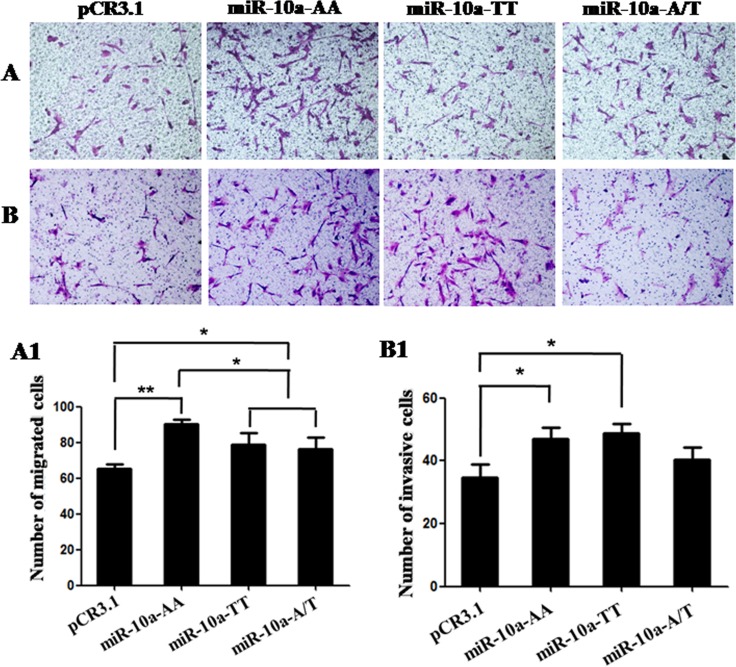
Figure 4. Cell migration and invasion in VCT cells transfected by different genotypes.
Cells migratory and invasive capacities were detected in VCT cells transfected by pCR3.1, pCR3.1-miR-10a-AA, pCR3.1-miR-10a-TT or pCR3.1-miR-10a-A/T. (A and B) Photomicrographs of migration and invasion cells 24 h after inoculation. The photographs were shown at x400 original magnification. (A1 and B1) Histogram of number of migration and invasion cells through filters. Data are expressed as the mean numbers of independent triplicate experiments. *P < 0.05, **P < 0.01.

