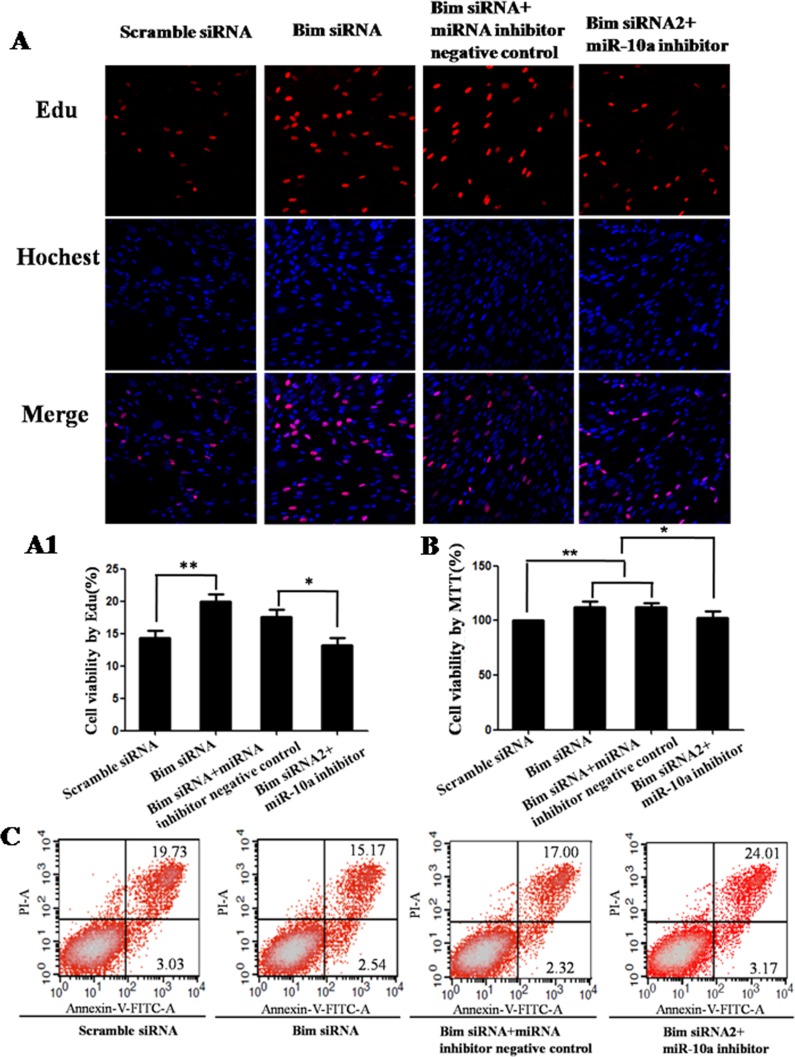
Figure 6. Cell growth analysis in VCT cells transfected by Bim siRNA with or without miR-10a inhibitor.
Cell proliferation was determined by EdU assay (A and A1) and MTT assay (B). Red represents the proliferative cells. Blue indicates cell nuclei. The photographs were shown at x400 original magnification. Cell apoptosis was detected by flow cytometry analysis (C). Lower left quadrant, viable cells (annexin V-FITC and PI negative); lower right quadrant, early apoptotic cells (annexin V-FITC positive and PI negative); upper right quadrant, late apoptosis/necrosis cells (annexin V-FITC and PI positive). The percentage of early and late apoptotic cells was shown in the lower right and upper right panels, respectively. All experiments were performed at least three times.*P < 0.05, **P < 0.01.

