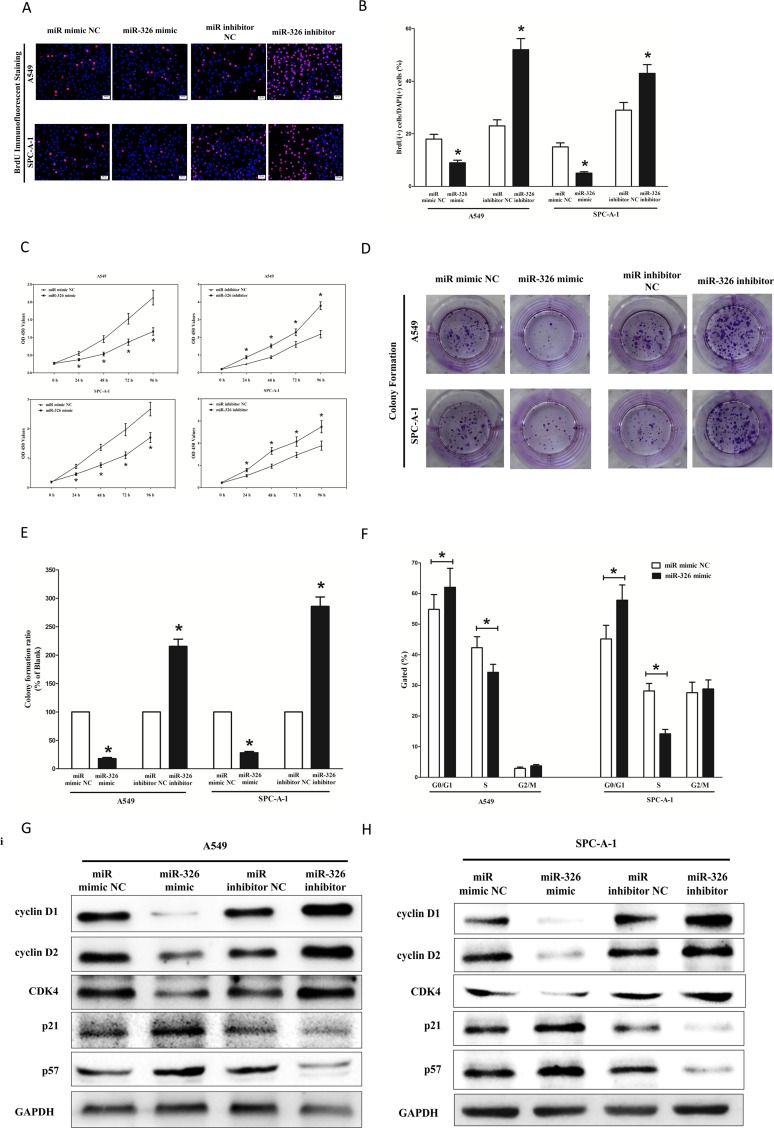
Figure 6. Ectopic expression of miR-326 inhibits proliferation and colony formation of A549 and SPC-A-1 cells.
(A) Shown are representative photomicrographs of BrdU staining after transfected A549 and SPC-A-1 cells with miR-326 mimic, miR-326 mimic NC, miR-326 inhibitor or miR-326 inhibitor NC for 24 h. Bar = 50 μm. (B) Statistical analysis of BrdU staining. (C) CCK8 assays of A549 and SPC-A-1 cells after transfected with miR-326 mimic, miR-326 mimic NC, miR-326 inhibitor, miR-326 inhibitor NC. (D) Shown are representative photomicrographs of colony formation assay after transfected with miR-326 mimic, miR-326 mimic NC, miR-326 inhibitor or miR-326 inhibitor NC for ten days. (E) Statistical analysis of colony formation assay. Assays were performed in triplicate. (F) Cell-cycle analysis was performed 48 h following the treatment A549 and SPC-A-1 cells with miR-326 mimic or miR-326 mimic NC. The DNA content was quantified by flow cytometric analysis. (G–H) Expression of cyclin D1, cyclin D1, CDK4, p21 and p57 protein in transfected A549 and SPC-A-1 cells. Assays were performed in triplicate. Means ± SEM was shown. Statistical analysis was conducted using student t-test.

