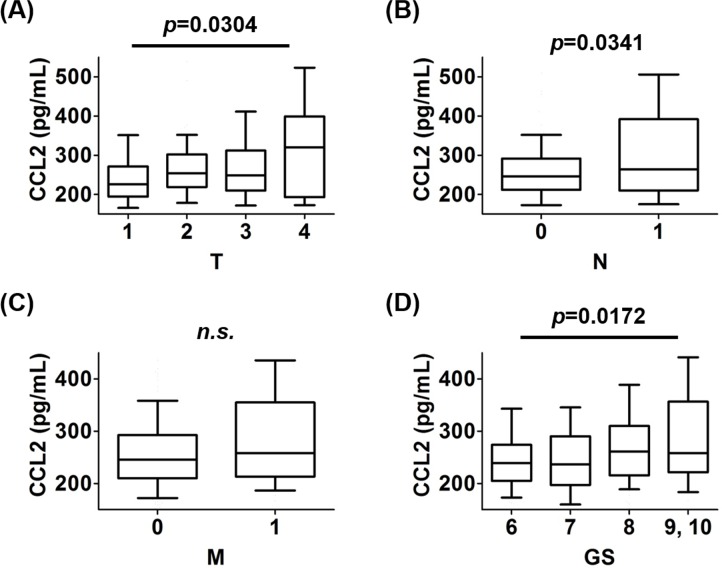
Figure 5. The prevalence of CCL2 values in each stage of TNM and GS.
A. The levels of CCL2 in patients with each T stage were analyzed. The level of CCL2 in patients with T4 was higher than those with T1. B. The levels of CCL2 in patients with each N stage were analyzed. The level of CCL2 in patients with N1 was higher than those with N0. C. The levels of CCL2 in patients with each M stage were analyzed. There was no significant difference in CCL2 levels between patients with M1 and M0 (p = 0.1277). D. The levels of CCL2 in patients with each GS were analyzed. The level of CCL2 in patients with GS ≥ 9 was higher than those with GS = 6.

