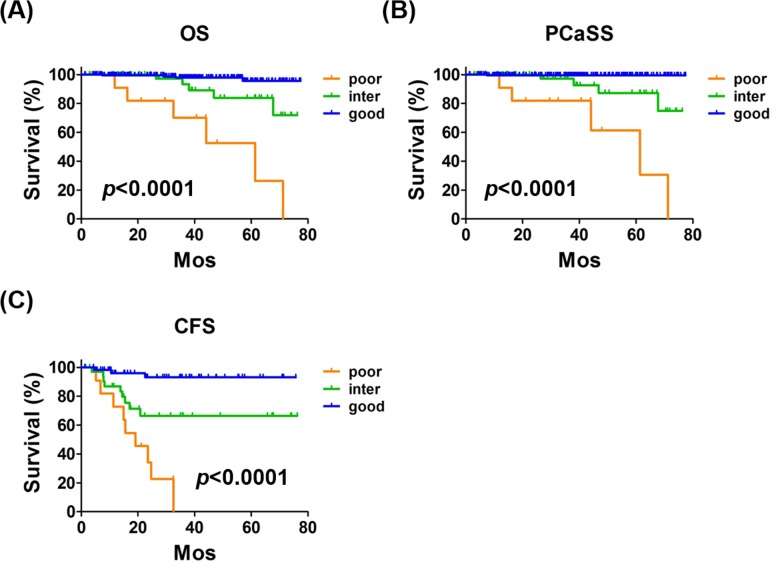
Figure 6. The novel risk classification.
The classification system was designed according to the number of risk factors (CCL2 ≥ 320 pg/mL and PSA ≥ 100 ng/mL) and 2, 1, and 0 were defined as poor, intermediate, and good risk, respectively. A., B.) Kaplan-Meier curves of OS and PCaSS in 255 patients with prostate cancer with poor, intermediate, and good risk. The 5-year OS rates were 52.6%, 83.8%, and 95.6% of patients with poor, intermediate, and good risk, respectively. The 5-year PCaSS rates of patients with poor, intermediate, and good risk were 61.4%, 87.2%, and 99.5%, respectively. C. Kaplan-Meier curves of CFS of 102 patients with prostate cancer treated with ADT. The 5-year CFS rates of patients with poor, intermediate, and good risk were 0%, 66.5%, and 93.0%, respectively.

