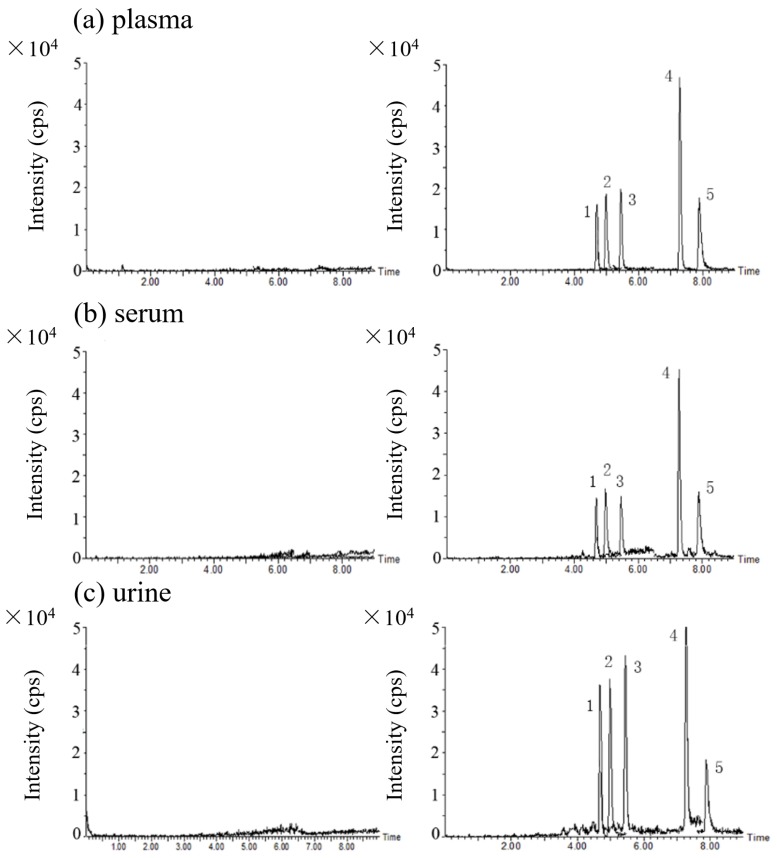
Figure 4.
The LC-MS/MS MRM chromatograms of blank matrices (left) and (1) α-amanitin, (2) β-amanitin, (3) γ-amanitin, (4) PHD and (5) PCD at their LLOQ levels in (a) plasma, (b) serum and (c) urine (right), respectively. The five quantification ion transitions (m/z 919.5 > 86.0, m/z 920.5 > 86.0, m/z 903.0 > 86.0, m/z 789.4 > 157.0, m/z 847.0 > 157.0) are overlapped in the chromatograms.

