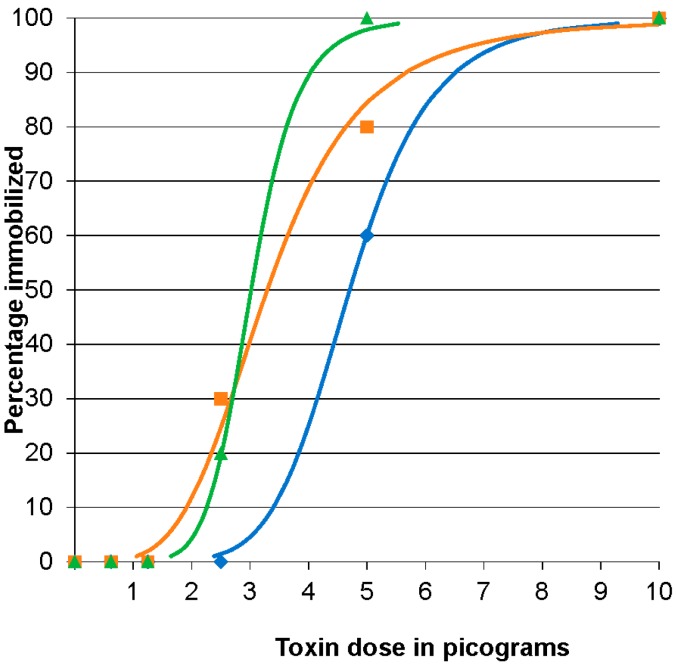
Figure 3.
Botulinum neurotoxin E (BoNT/E) 96 h immobilizing dose response curves for zebrafish. Fish were injected intracoelomically with 10 µL containing 10, 5, 2.5, 1.25, or 0.62 pg BoNT/E activated with trypsin in gelatin phosphate buffer (n = 10 fish/treatment/replicate). The results of three replicates are shown. The actual percentage immobilized for each dosage in each replicate is indicated by the symbol corresponding to the calculated curve of the same color. Blue curve and diamonds, orange curve and squares and green curve and triangles represent data from replicates 1, 2 and 3 respectively.

