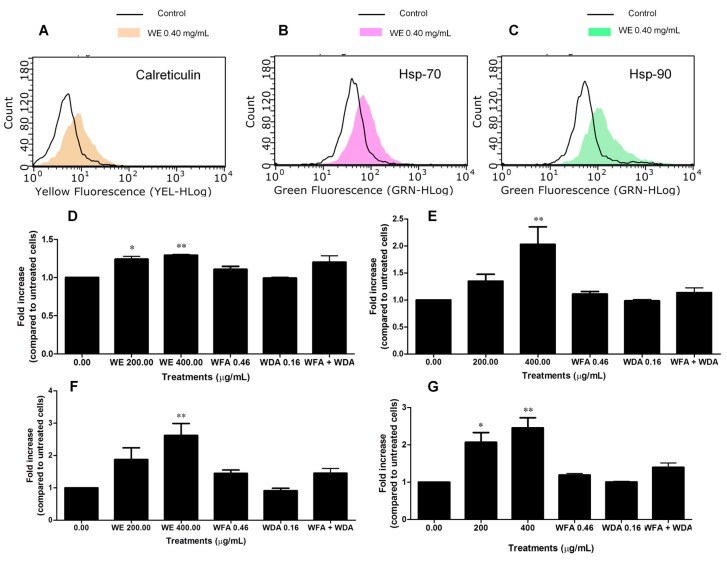
Figure 6.
Fluorescence hystograms of: immunolabeled calreticulin (A); Hsp-70 (B); and Hsp-90 (C). Modulation of the expression of: calreticulin (D); Hsp-70 (E); Hsp-90 (F); and of ATP release (G) after treatment with WE, WFA, WDA or WFA plus WDA. Histograms are representatives of three independent experiments. * p < 0.05, ** p < 0.01 versus untreated cells.

