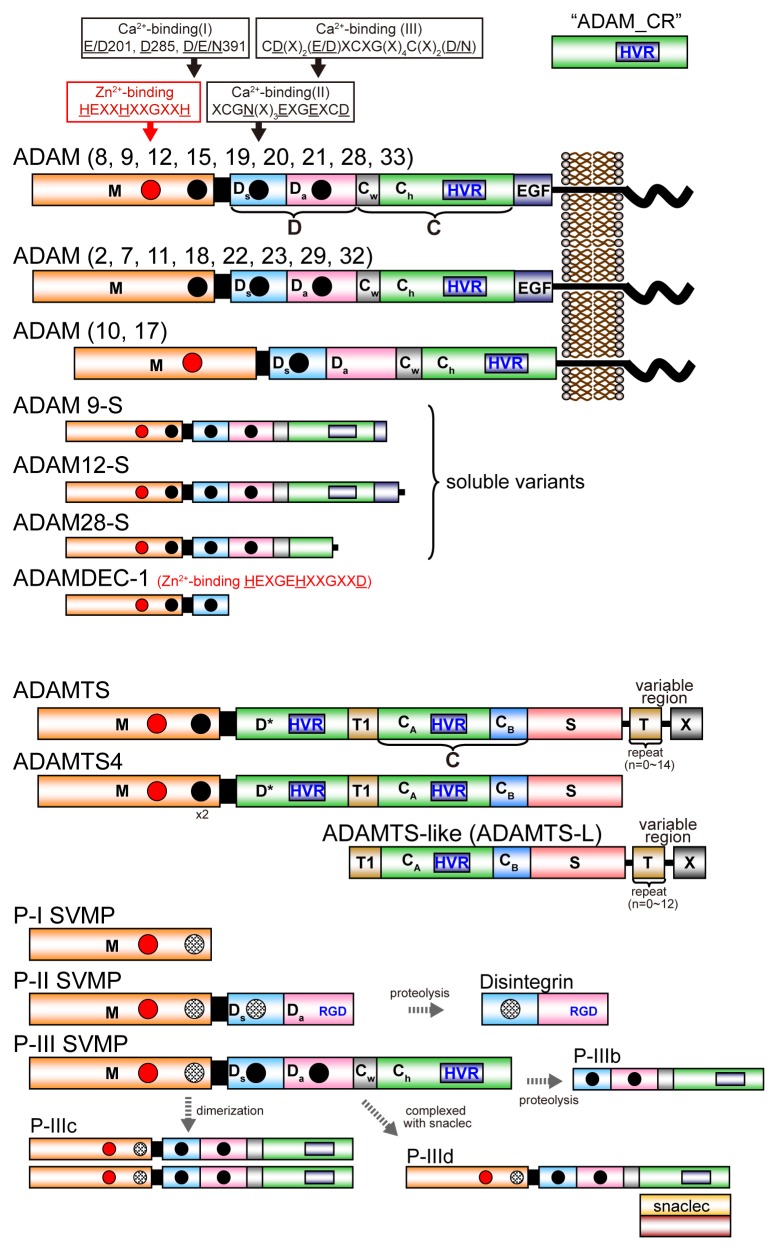
Figure 1.
Schematic diagram of the domain structure of M12B proteinases. Each domain or subdomain is represented by a distinct color. The Ch subdomain of ADAMs and P-III SVMPs, D* domain of ADAMTSs, and CA subdomain of ADAMTSs and ADAMTS-Ls, adopt the ADAM_CR domain fold and are thus shown in the same color. The region that is variable among ADAMTSs and ADAMTS-Ls is shown as X.

