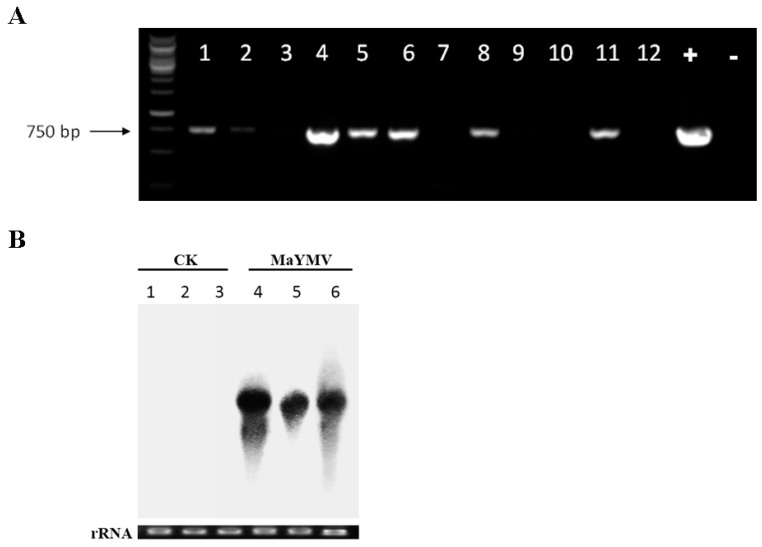
Figure 6.
Agroinoculation infectivity assays using pCB301-MaYMV and N. benthamiana plants. (A) RT-PCR analysis of not inoculated (systemic) leaves infected by MaYMV. The numbers from 1 to 12 correspond to individual plants inoculated with pCB301-MaYMV infectious clone. “+” represents the positive control (using plasmid pCB301-MaYMV as a PCR template); “−“ represents the negative control (using the cDNA from mock-inoculated N. benthamiana as a PCR template); and (B) Northern blot analysis of MaYMV RNA obtained from pCB301-MaYMV-agroinoculated upper leaves of plants and the MaYMV CP ORF-derived cDNA probes. Equal loading of total RNA (20 μg) was validated by ethidium bromide-stained agarose gels as indicated at the bottom of the panel. Numbers 1–3 correspond to the replicates of the negative control; numbers 4–6 are the replicates of samples from plants agro-inoculated with pCB301-MaYMV.

