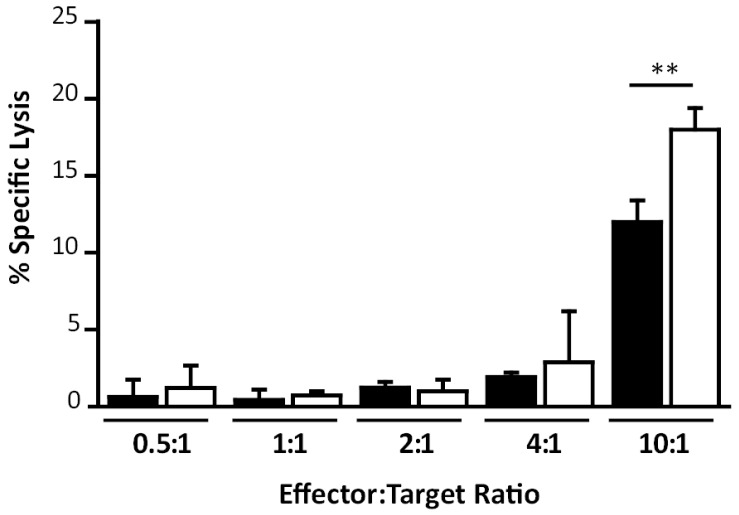
Figure 7.
Study of in vitro T-cell specific killing activity. Specific cytotoxicity assay against B8R-pulsed cells was performed as described in Materials and Methods. Data are expressed as mean + SD of triplicate determinations and represent two independent experiments. Significant differences between MVAwt (black) and MVA∆C12L/∆A44L-A46R (white) are shown. One-way ANOVA and Bonferroni’s post-test. ** p < 0.01.

