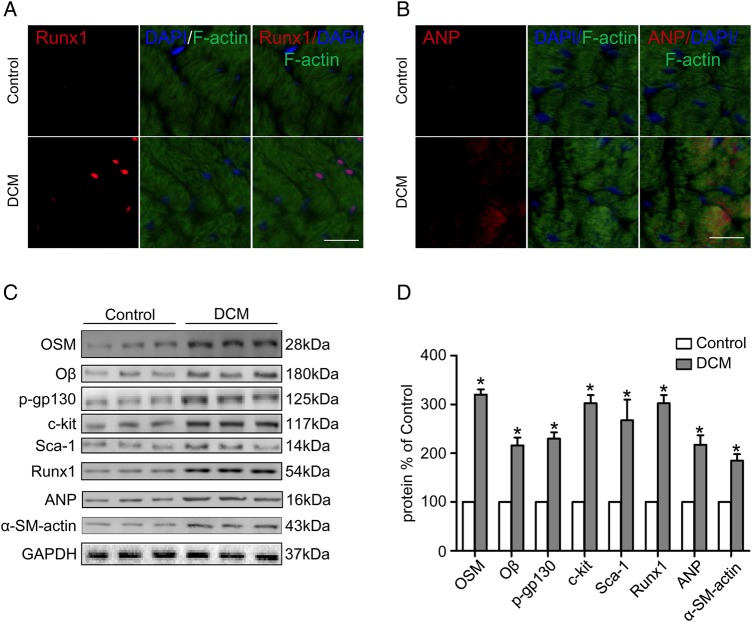
Figure 2.
DCM mice showed increased expressions of OSM and its receptor Oβ in heart (A, B) Fluorescent immunostaining of Runx1 and ANP expression (red) of cardiomyocytes (green) (scale bar = 30 μm). (C) Western blot analysis showed increased expression of OSM, Oβ, p-gp130, c-kit, scal-1, Runx1, ANP, and α-SM-actin in the DCM group. (D) Statistical analysis of western blot results. *P < 0.05 vs. control group.

