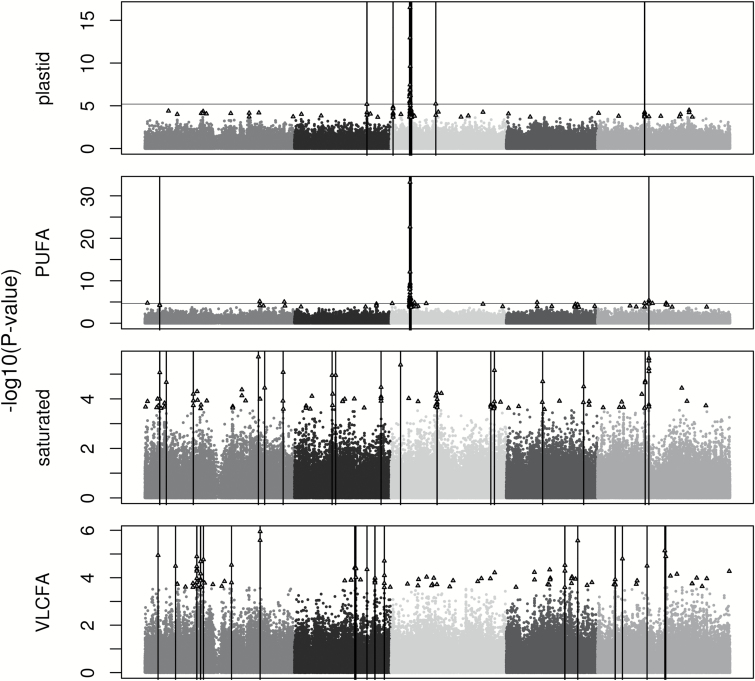
Figure 4.
Genome-wide association mapping results for the 4 composite traits in Arabidopsis thaliana using the efficient mixed model association package in R. The 5 chromosomes are represented by different shades of gray with the x axis as physical position. Triangles depict the top 100 SNPs for each trait. Vertical bars represent the physical positions of the regions of interest. A genome-wide significance level of FDR < 0.1 is indicated by a horizontal line. Traits lacking a horizontal line do not have significant SNPs at FDR < 0.1.

