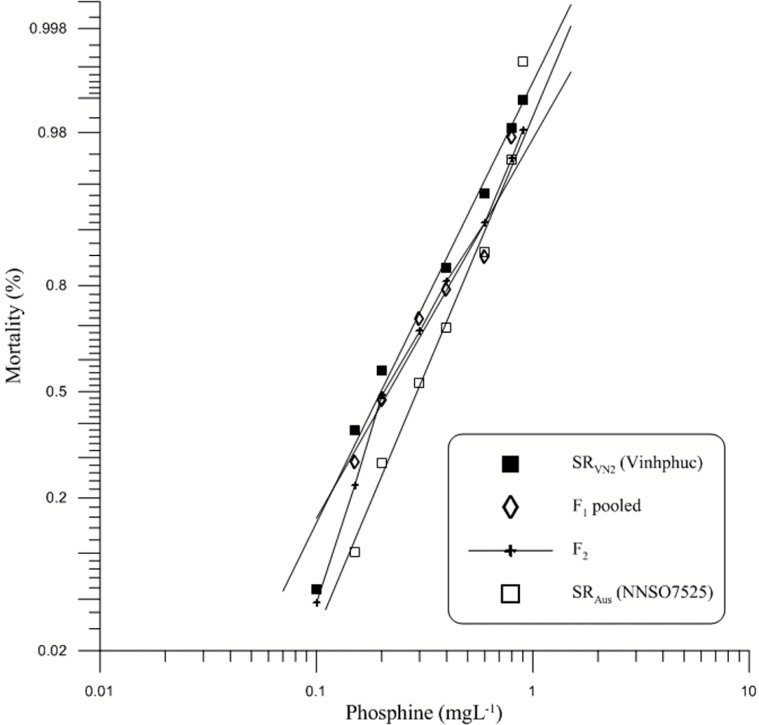
Figure 2.
Mortality response of parental (P0) strains (SRAus, SRVN2) as well as their F1 and F2 generations after exposure to phosphine for 48h without food at 25 ºC, 60% RH. The expected response lines of the P0 and F1 were drawn using a probit linear model y = αx + β in which α and β are the slope and intercept, respectively. x is the log-transformed dose. y is the percent mortality. The observed mortality of parents and the F1, F2 generations are also displayed.

