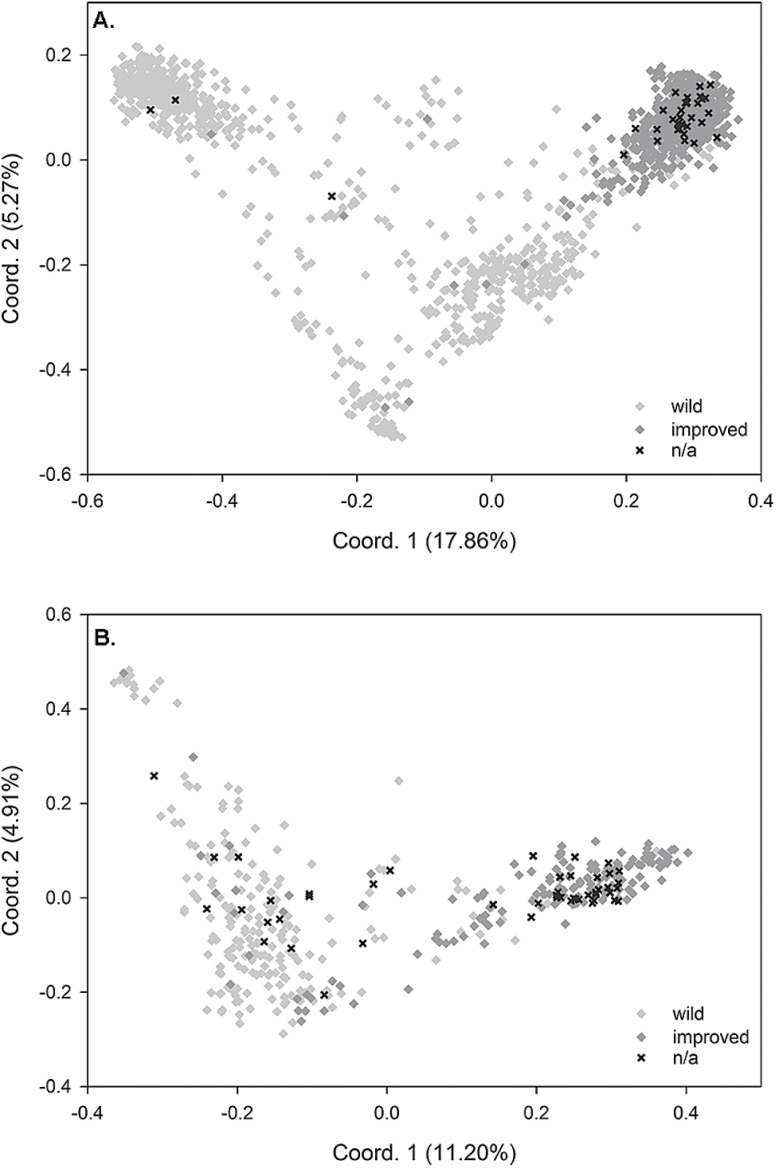
Figure 2.
Principal coordinate plots showing patterns of separation between wild and improved accessions within (A) G. hirsutum explaining 23.13% of the variation and (B) G. barbadense explaining 16.11% of the variation. Accessions which could not be classified into either category are labeled “n/a”.

