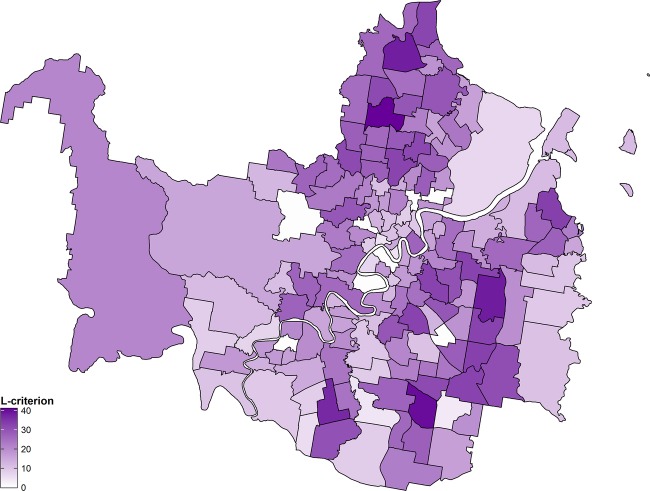
Figure 4.
Map of SLAs in the Brisbane region (Moreton Island not shown) depicting the closeness between yij and  for each SLA for the final (modified) BaySTDetect model, as specified by the L-criterion defined in equation (11). Lighter regions represent SLAs with smaller aggregated L-criterion estimates. SLAs, statistical local areas.

